Not Gonna Get Too Dirty… Yet
So regarding that deceptively simple plot, once I was done putting it together I got to thinking (uh-ooh) about some questions and points of interest. Sure, we didn’t break any ground with the graphic but it was meant as a starting point for further investigation and that’s what this post is about: digging a little deeper.
 Data Source: Beer Institute
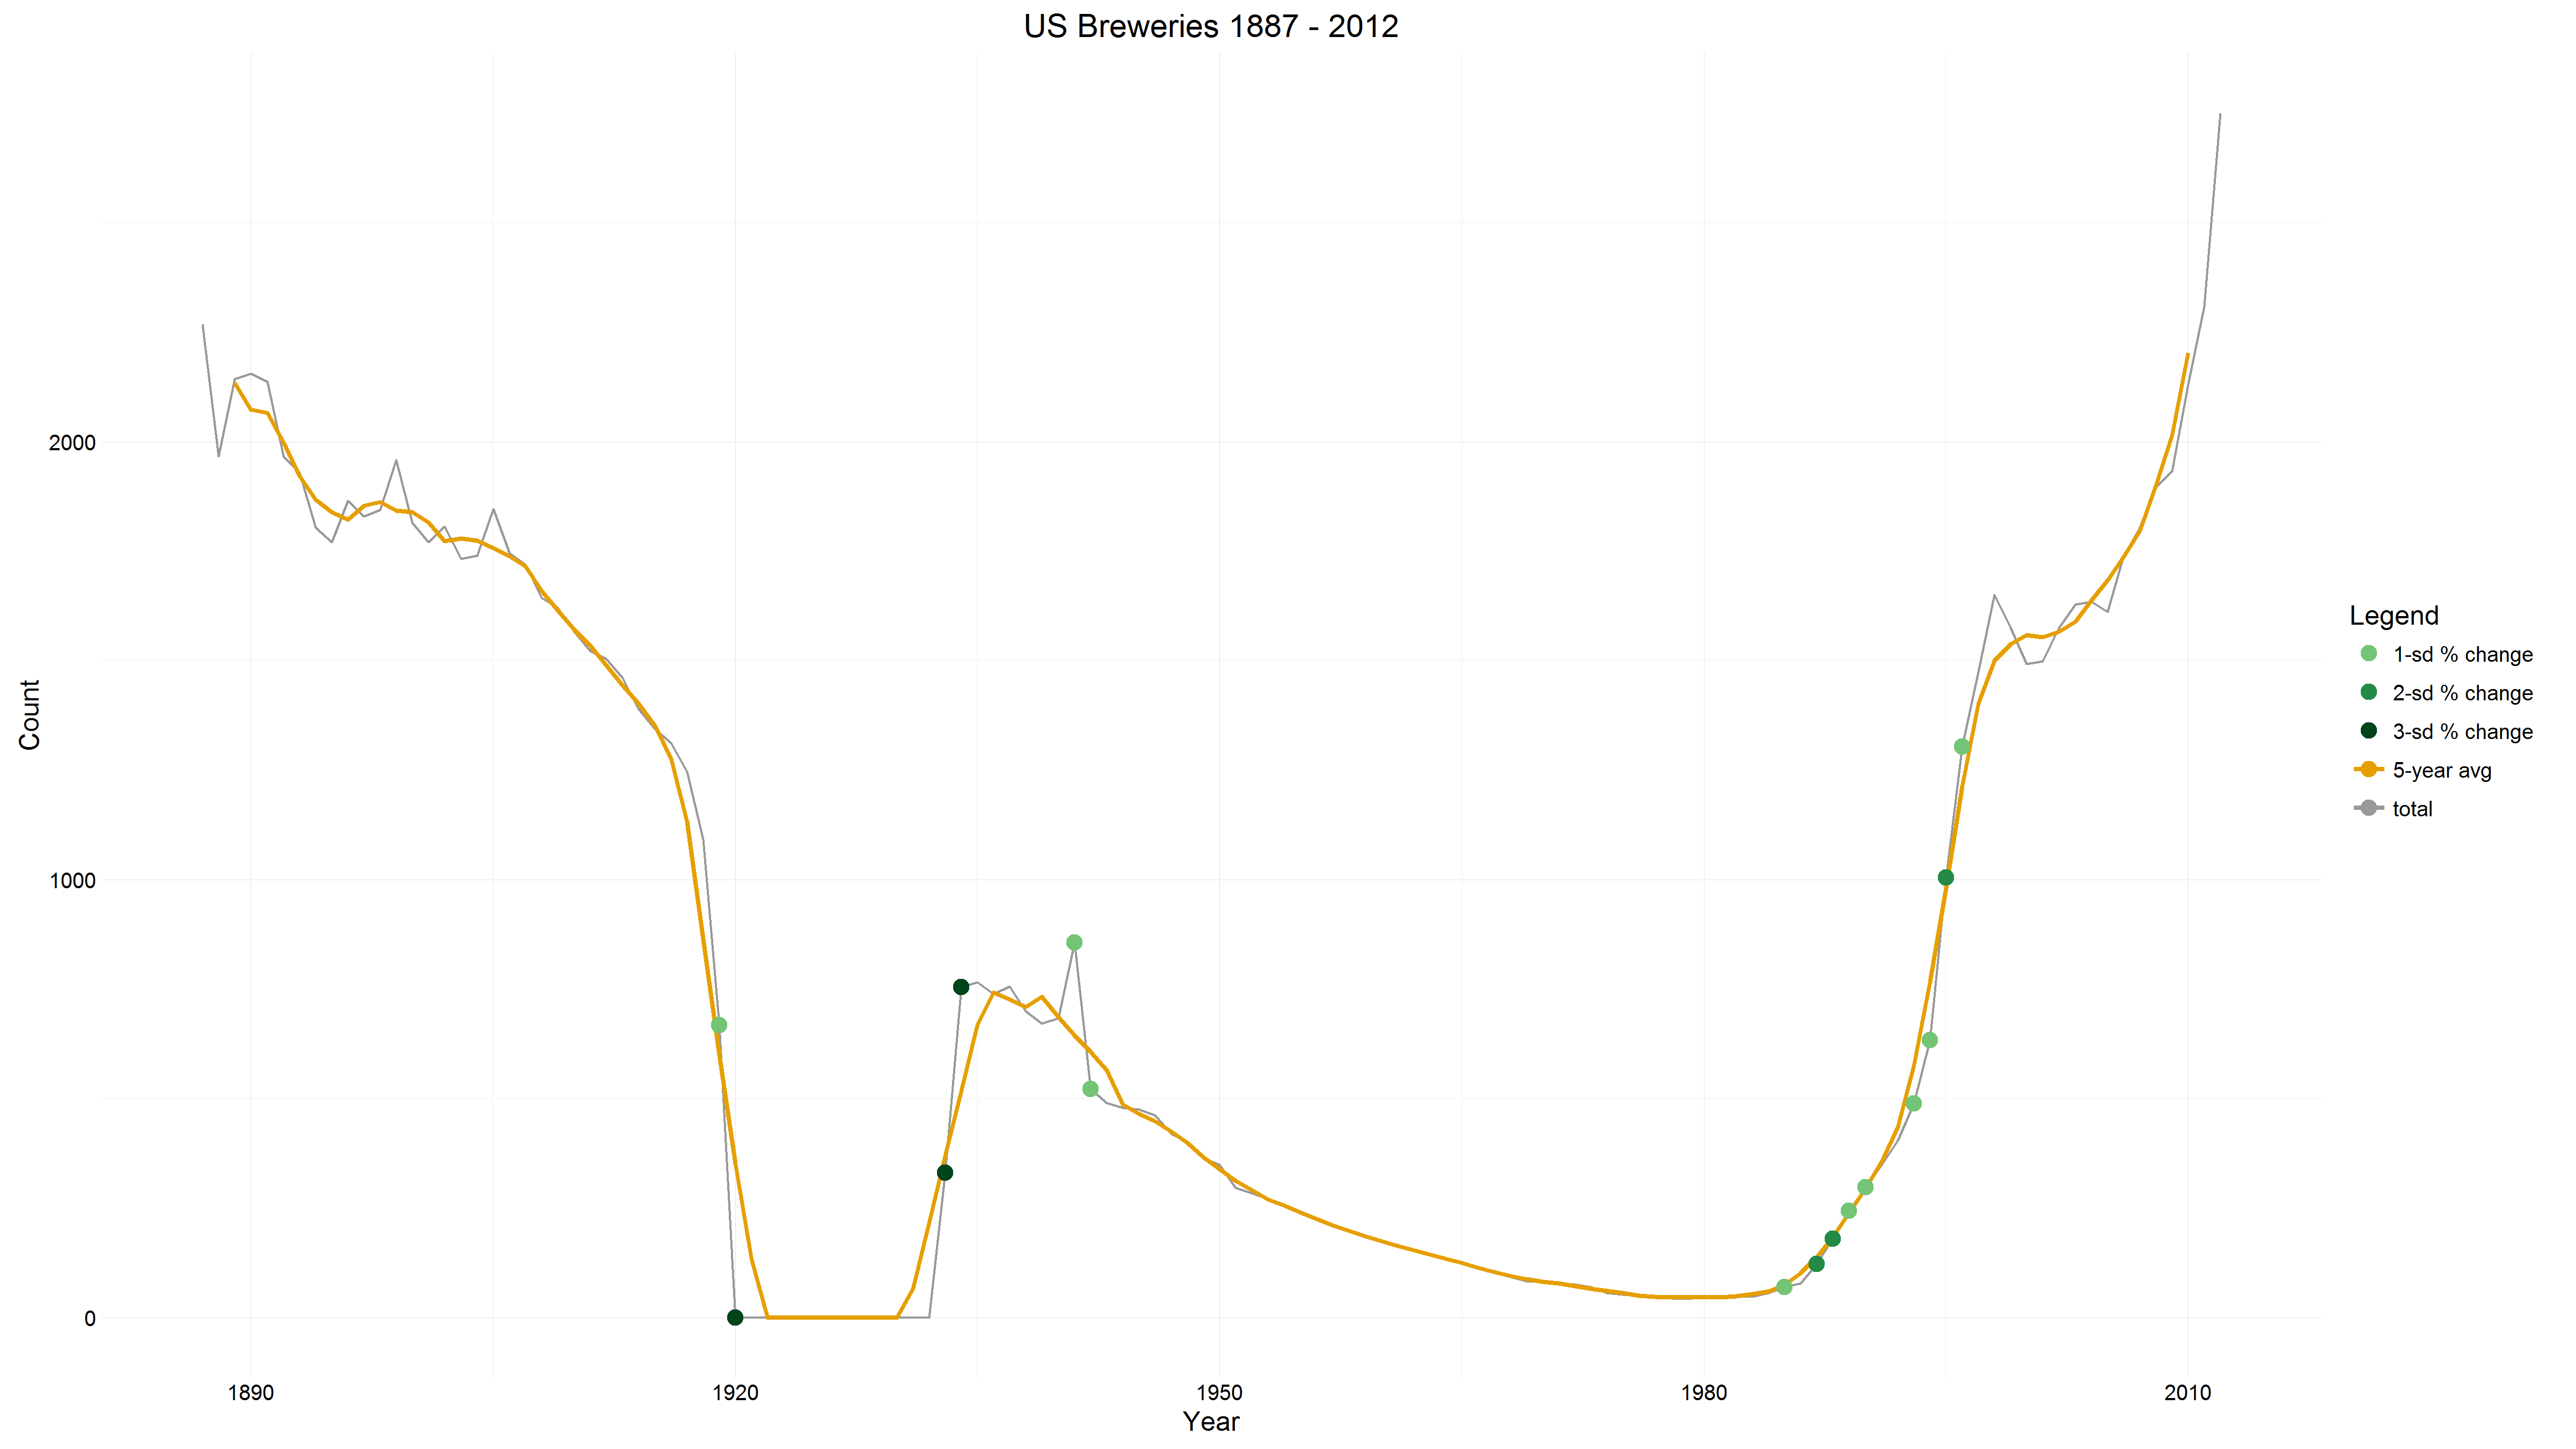
First the “obvious” things. If you knew a little about American history and a little about beer and a little about, I don’t know, math perhaps (how’s that for a Venn diagram?), then you probably would have guessed that the biggest changes in brewery counts would happen around Prohibition (1920 - 1933). And you would be correct, to an extent. The most extreme years, the ones that saw percent changes in the number of breweries of three standard deviations or greater, did all straddle this time frame. Breweries shuttered their doors in anticipation of a dry nation and did the reverse once it was legal to resume business. The collapse and skyrocketing in the number of breweries during this time can be safely explained away.1
I mentioned being correct to an extent because there is another era that, while it saw years of a less extreme swing, had more big-change years2 grouped together. You wouldn’t need any more math, but an interest in craft beer and/or an awareness in the explosion in beer selections at bars and supermarkets [reference pending] could have provided a hint to thinking we may be living through another time of great change. Once again you would’ve been right, and once again to an extent. While the number of breweries continues its 30+ year upward trajectory, and we now have more such businesses than ever, the biggest relative gains were realized over two decades ago.3
US Breweries - Top-20 Years by Absolute Percentage Change
(sorted in descending order of standard deviation)
| year | total | perChgTot | stdChgTot |
|---|---|---|---|
| 1933 | 331 | Inf | Inf |
| 1934 | 756 | 1.2839879 | 6.5042751 |
| 1920 | 0 | -1.0000000 | 5.0656825 |
| 1995 | 1006 | 0.5867508 | 2.9722932 |
| 1987 | 123 | 0.5569620 | 2.8213928 |
| 1988 | 181 | 0.4715447 | 2.3886958 |
| 1942 | 523 | -0.3897316 | 1.9742567 |
| 1919 | 669 | -0.3873626 | 1.9622561 |
| 1989 | 244 | 0.3480663 | 1.7631934 |
| 1996 | 1305 | 0.2972167 | 1.5056054 |
| 1994 | 634 | 0.2938776 | 1.4886904 |
| 1941 | 857 | 0.2529240 | 1.2812326 |
| 1985 | 71 | 0.2456140 | 1.2442027 |
| 1990 | 298 | 0.2213115 | 1.1210937 |
| 1993 | 490 | 0.2098765 | 1.0631679 |
| 1974 | 57 | -0.1971831 | 0.9988670 |
| 2012 | 2751 | 0.1914249 | 0.9696976 |
| 1991 | 350 | 0.1744966 | 0.8839446 |
| 1984 | 57 | 0.1632653 | 0.8270502 |
| 1992 | 405 | 0.1571429 | 0.7960358 |
Five of the 10 biggest years of all time (using 1887-2012 data) with respect to changes in breweries by percentage happened between 1987 and 1996, all of them positive. Seven of the next 10, so twelve out of the twenty most dramatic years by brewery percentage change, for those of you not bothering to keep count (don’t worry, that’s what I’m here for), also took place in the overlapping time frame of 1984 to 1994. Again, all positive. Those twelve “banner” years out of thirteen, 1986 being the sole slouch between 1984-1996 growing at only 11%, saw gains on top of gains bring the total brewery count from 49 in 1983 to 1,305 in 1996, a 2,500+% increase.
One last note on how remarkable this time frame was: it was steeper in adding breweries than the pre-prohibition period was in shedding them over the same time period (excluding the “Last Call” of 1920); more on this in other posts, but in a sense people were opening up more breweries at a time of uncertainty (when are things ever certain?) and little general popularity than businesses were shutting down ahead of the outlaw of alcohol production in the US (larger overall population [1980’s v. 1910’s]; the time it takes to close/sell off a business; two years 1919/1920 accounting for most of the closings, 1,000+ breweries; & vested interests and resistence are just a few obvious mitigating circumstances that pop to mind).
So why this surge, could there be another historical event we can point to? Yes and a quite easily identifiable one: Jimmy Carter. Though the 21st Amendment (1933) repealed the 18th Amendment (booo!) and brought an end to the Volstead Act, it was still unlawful to brew alcohol for ones one consumption until 1978. That all changed when your favorite peanut farmer and mine signed H.R.1337. Homebrewing took off in the US soon after: hobbyists, clubs, associations, published books, you name it. This fertile ground of experimentation, with people’s interest in more flavorful foods [reference pending], led to the foundation of the mirco/craft beer “revolution” we’ve been lucky enough to experience so very recently.
So where does that leave us?
- Going back to the original plot and newly supplied table we can see that some peaks and valleys, while easily noticable, are NOT as big of percentage changes as we might assume (see: 1887-1905 & 2000-2012). This signals that we need a better visual representation to identify these percentage changes; the plot as it is now is most useful for absolute numbers and general historical trends.
- Just because some of these spikes are not remarkable in percentage terms does not mean they are not interesting with respect to both causes and effects. History buffs may be quick to point to all but forgotten economic recessions and panics for some of the changes of the 19th and early 20th century. In our more recent past, what may reasonably be called the first craft beer bubble gets some play in the Redhook book.
- Regarding the big percentage change years, a majority of them can be seemingly explained away by Prohibition and President Carter. But to what extent did World War II have an impact on the big up and down movements of 1941 and 1942, respectivley?
- Lastly, the most boring looking section, from 1945-1982/3 when the year-to-year reality of brewery counts looks identical to the 5-year average, while perhaps not the most interesting may arguably be the most important. This is the time of the big boys getting bigger through marketing [reference pending], acquisitions, new distribution channels, and, queue sad music, the commodification of beer.
New Toy Vis
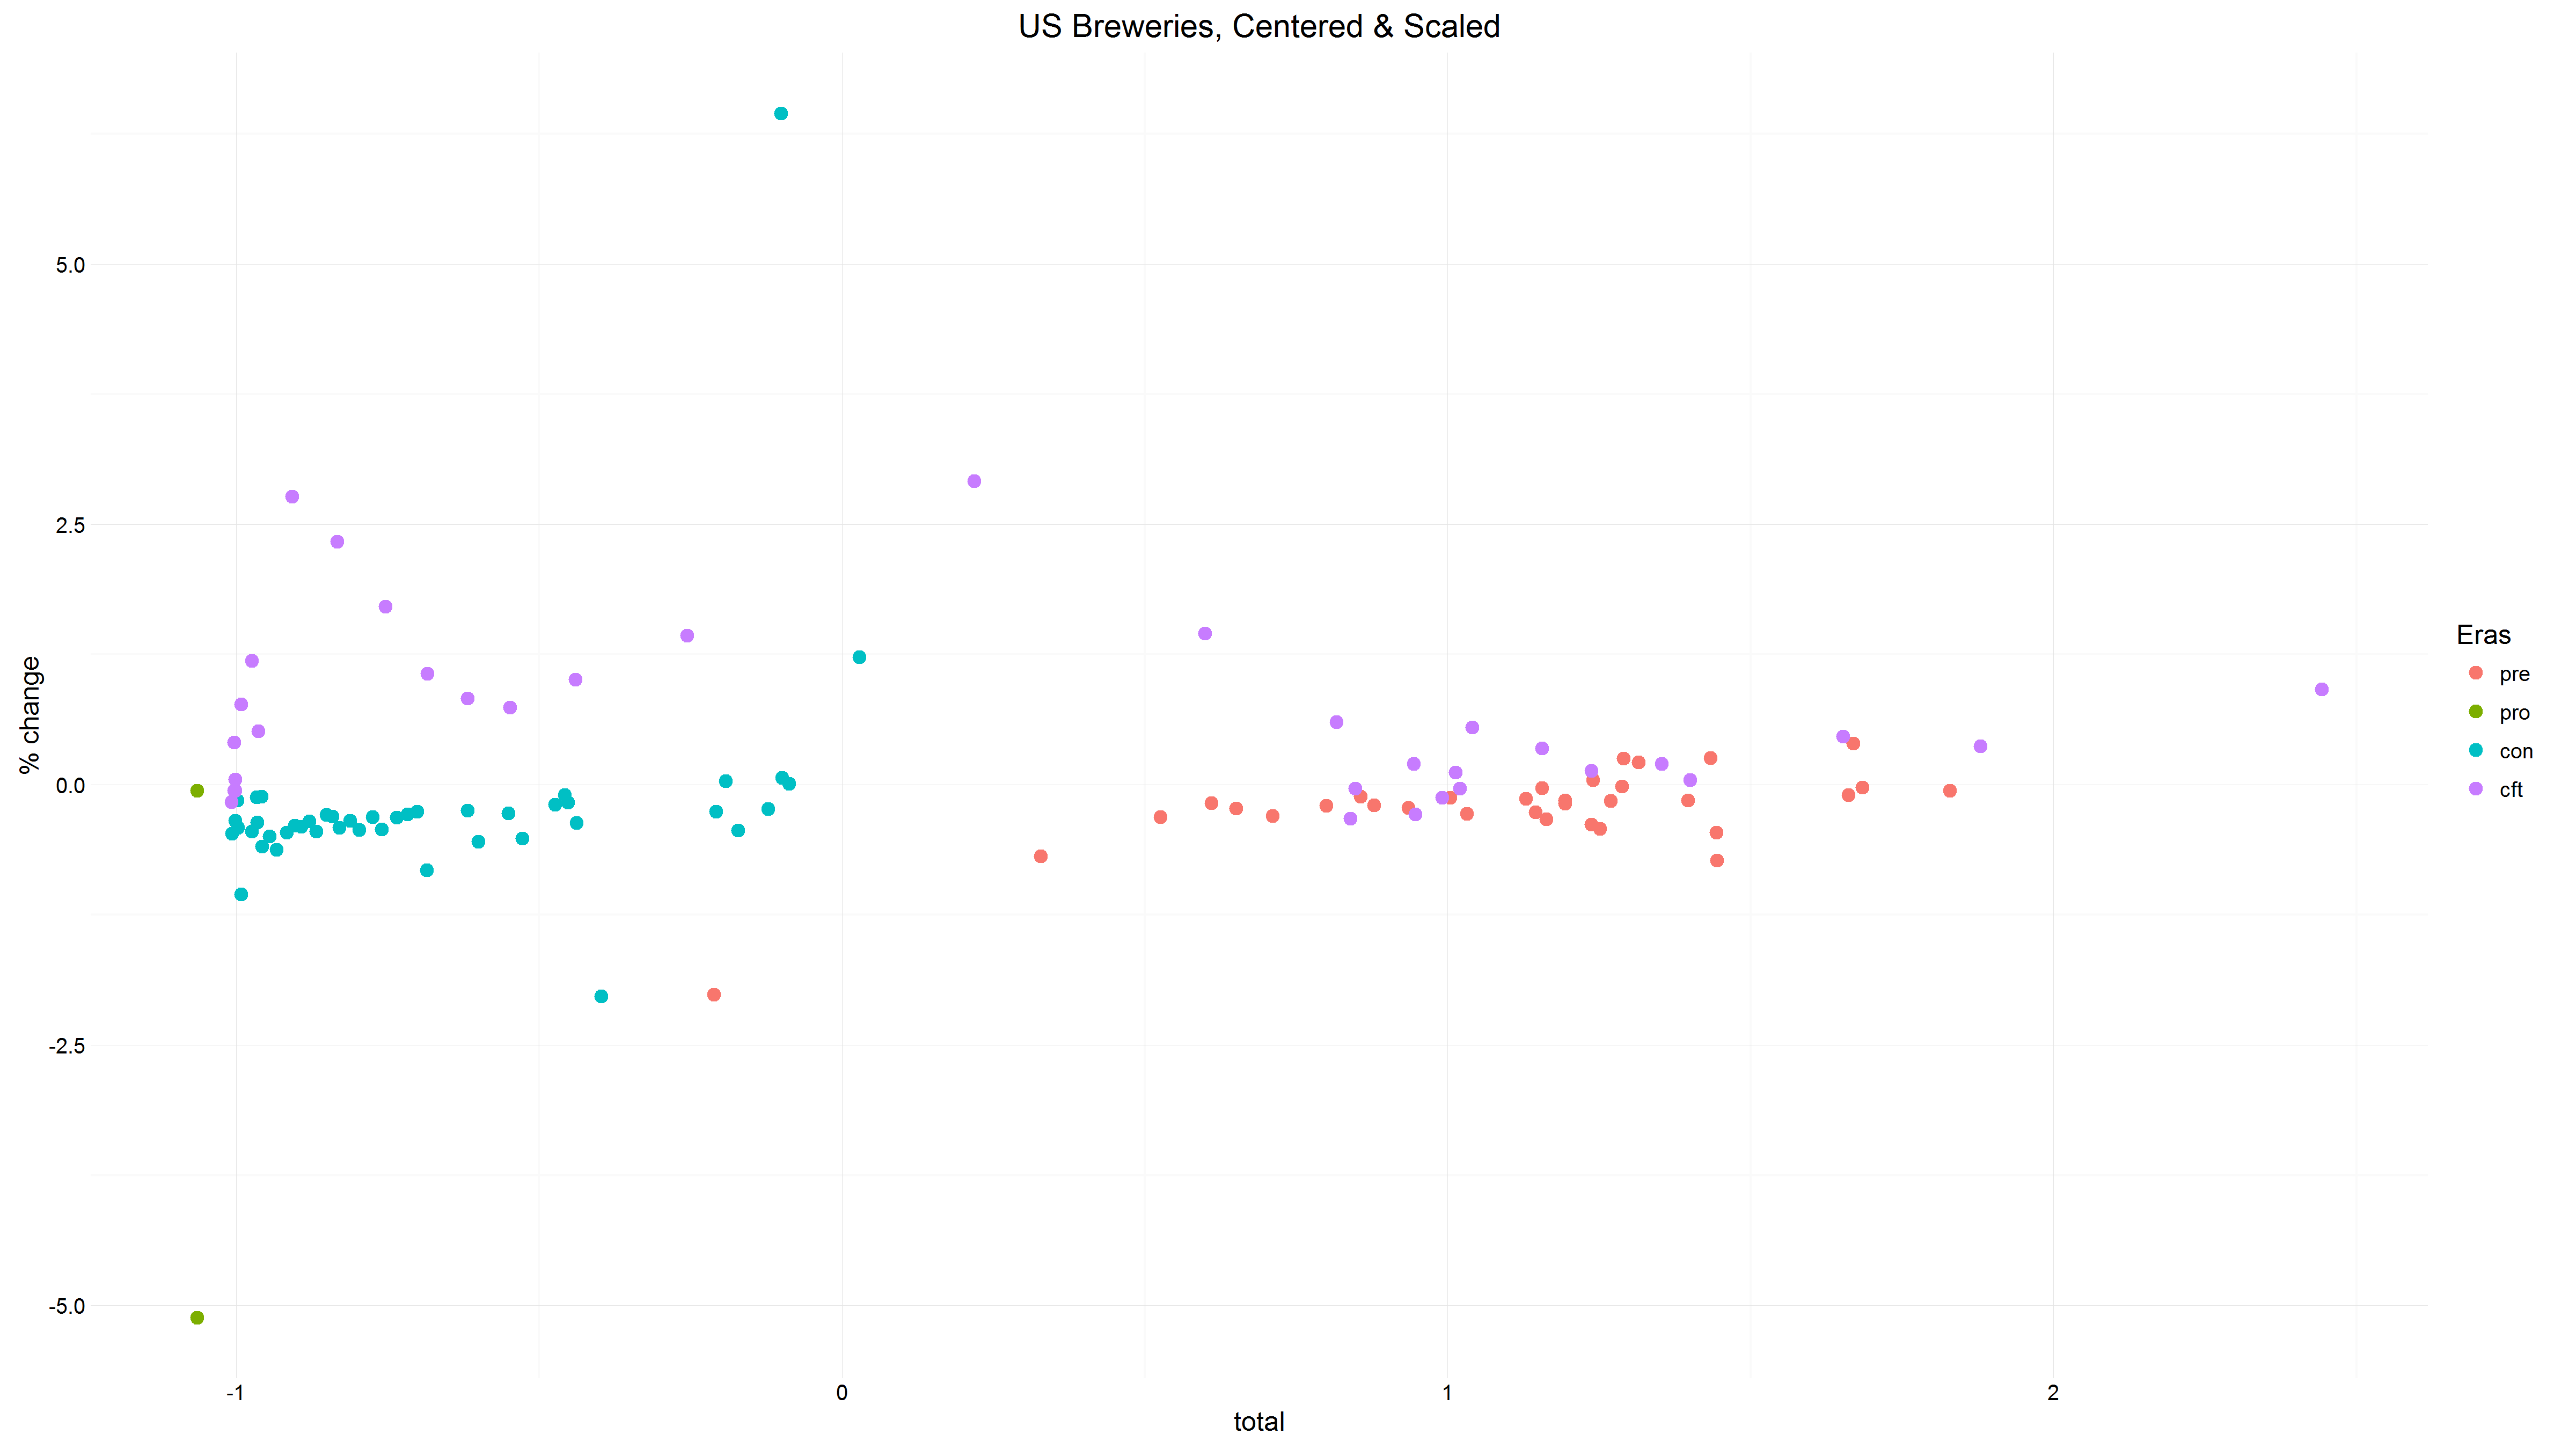
A remix of the data presented to date: the idea was to plot the brewery years on two attributes and see if groupings by eras had particular profiles.
 Data Source: Beer Institute
| Era | Description | Years |
|---|---|---|
| pre | Pre-Prohibition | 1887-1919 |
| pro | Prohibition | 1920-1933 |
| con | Consolidation | 1934-1978 |
| cft | Craft | 1979-2012 |
We could run kmeans clustering but I’ll spare us both the pizzazz for another time. Let’s just eye-ball it this time and write out our interpretations. From left-to-right we see two primary groups, on opposite sides of the brewery count average (centered & scaled). This matches our intuition and cursory review of the original plot: two peaks by brewery count on opposite ends of the time range, with a large trough in-between. The group on the right is made up exclusively of pre-Prohibition and Craft beer years, as just hinted at. There are more pre-Prohibition years and the Craft years tend to positive growth (above zero from top to bottom).
Craft years are also found on the left side of the plot, which makes sense since the revival came at a time of very few breweries, but they distinguish themselves from their left-side Consolidation counterparts by being clearly in the positive growth portion. The positive/negative percent change divide between Craft and Consolidation groups speaks to our narrative and lends credibility to the “Eras” grouping as implemented.
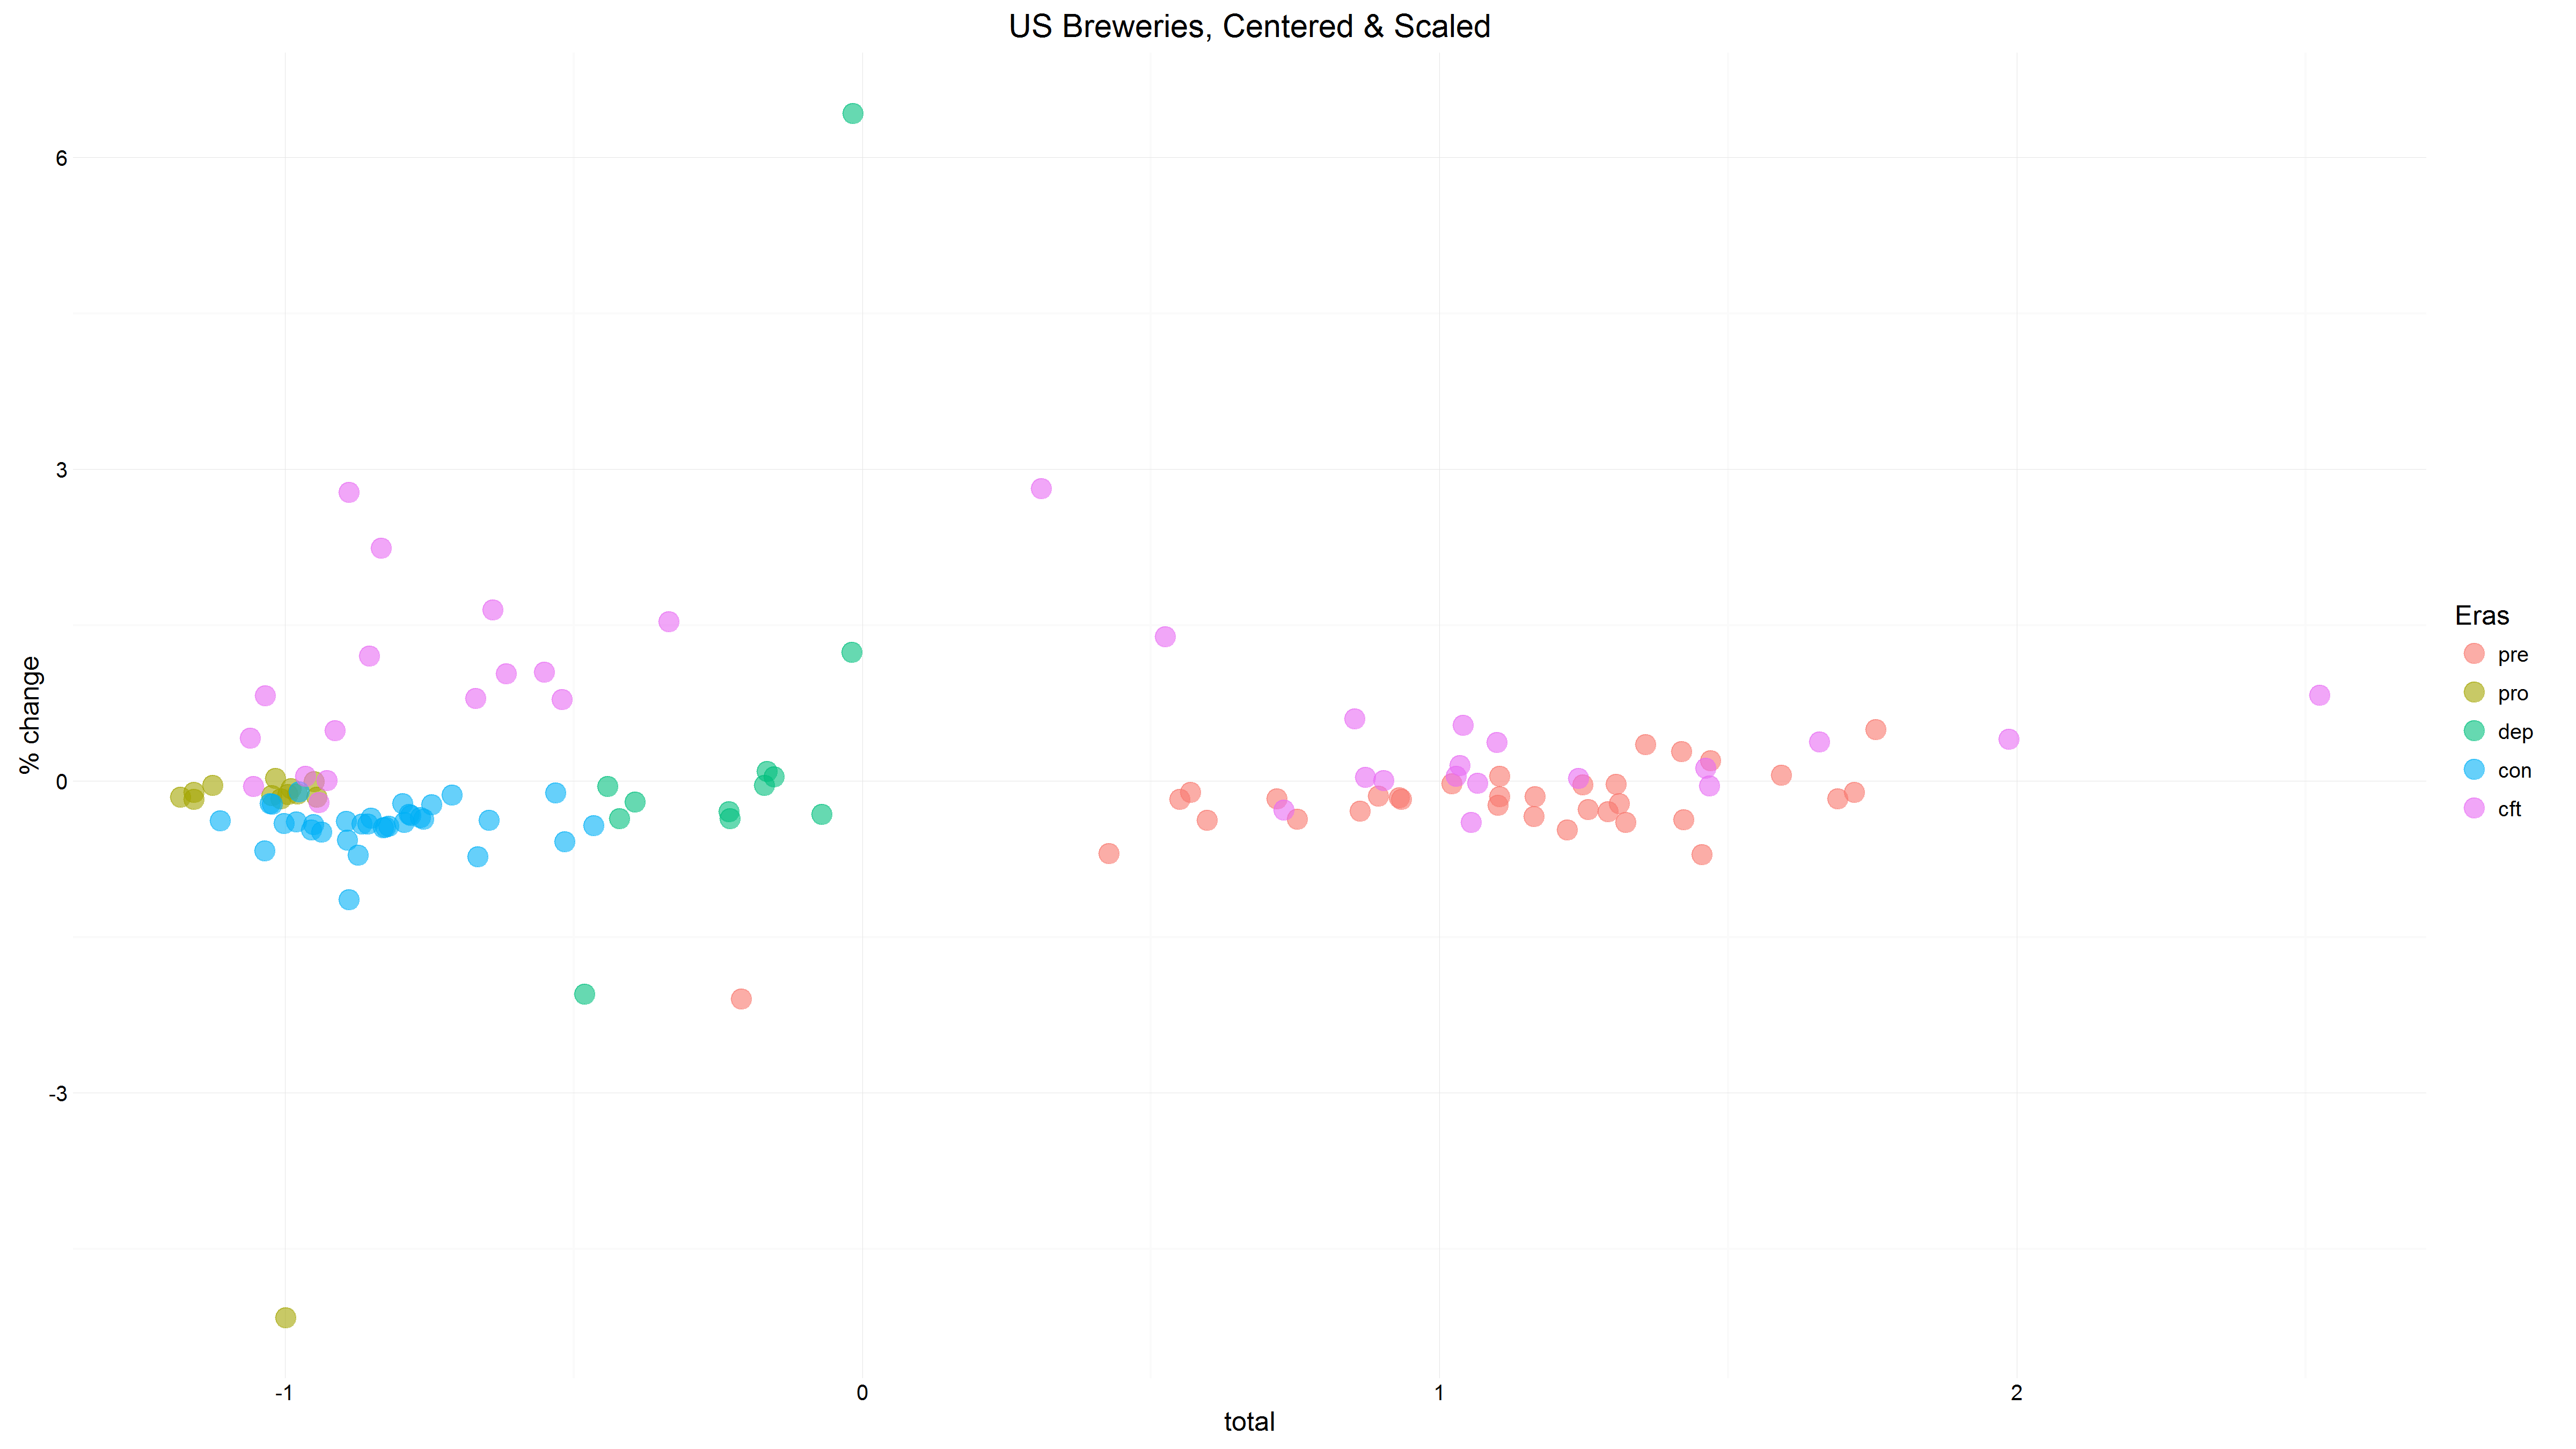
Two more items before moving on. First, nearly all prohibition years are obfuscated by having identical measures plotted to the same point (the green dot near [-1,0] which is really 12 dots on the same spot). Second, we have some large percentage changes for the Consolidation group, most notably the dot above the horizontal 5.0 mark. This speaks to the immediate post-Prohibition year(s) and perhaps a too naive grouping. It may be reasonable for this “Era” to be split into a pre and post Depression/WWII grouping. Below is a revised version of the plot.
 Data Source: Beer Institute
| Era | Description | Years |
|---|---|---|
| pre | Pre-Prohibition | 1887-1919 |
| pro | Prohibition | 1920-1933 |
| dep | Depression / WWII | 1934-1945 |
| con | Consolidation | 1946-1978 |
| cft | Craft | 1979-2012 |
We now see the Prohibition years a little bit better, the Consolidation years are even more tightly grouped together, and we see the Depression/WWII years having some of the wide growth/retrenchment swings.
The story so far has been fairly straight forward, crude, and a bit naive. Moving forward we will need to begin adding some nuance. Most obviously we need to introduce a) beer production over time and per capita, b) segment the industry by macro, micro, and import, & c) add economic data on an industry and national/regional level.
Items For Future Consideration:
- Create a better visualization to identify brewery percentage changes by year.
- Let’s call the current period the second run/bubble of craft beer. What causes and effects will surround its popping? A leading candidate is acquisition.
- Trace big boy acquisitions, 1945-1980.
- Segment by macro/micro/import.
Notes
1 It will be rare that I get to say this, so I thought I should take the opportunity to do so now. ↩
2 Yep, that’s the technical term. ↩
3 The change in absolute numbers however are remarkably similar: 1984-1996 (+1,248 breweries), 2000-2012 (+1,258). ↩