Whatchya got in that cup? Man, whatchya got in that cup?
Everyone likes a drink now and again. You can’t help it if others don’t always appreciate the difficult week, new promotion, recent break up, or birthday celebration of the moment that has brought on a little imbibing. Apparently, some people can be so bothered by this form of expressiveness that they feel the need to have someone step in. That is where a “friendly” 311 call comes in. With summer officially starting today I looked to last year’s numbers to see what we may expect to deal with.
I was expecting far more calls and far more variety. For the entire summer of 2016 there were only 600+ calls (311 Social) across the five boroughs and they all fell into one of three complaint categories: after hours, public drinking, and under age.
By far the most common, and something I touched on earlier, was public drinking. This makes intuitive sense. The other two categories are a bit more difficult to be aware of. Presumably any place attempting to stay open after hours is in a non/limited residential area. Any local bar that routinely tests their neighbors’ patience will be hard pressed to stay open long without complaints, followed by summons and possible closure with enough community pressure.
As for the under age drinking, I am trying to imagine how these calls went down. Being outside of a venue you would have to have seen some young-ass looking people going into a bar. Clubs often cater to 18-year-olds and up, so I am thinking the spots getting tattled on would be more of the bar/lounge types. The other main option that comes to mind is actually being in a place and spotting (again) young-ass looking people, a.k.a. children, in the place. I suppose the discrepancy in appearance must be pretty egregious to make someone actually pick up the phone and make that call. What do you tell the operator? “Hey, there’re some children in the bar I am drinking at. Get them out of here. I don’t like what it says about this place, myself, or the children themselves that we’re all drinking here.”
Perhaps, it’s not so much the appearance of the suspected youngins as it is their behavior. We all know “da yutes” get a little carried away and sometimes drink a bit too hard, acting as if they’ve never been out before. Maybe in some instances that is the case.
Data Source: 311, Social Services
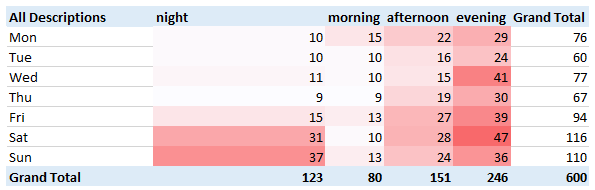
Public drinking calls accounted for more than two-thirds of all 311 calls. Instances of such drinking occurred in all boroughs, and every day of the week, at anytime of the day. Predictably, the public “happy hours” straddled the weekend, from Friday through Sunday. This bump in numbers indicates what we all could have guessed at, people cutting loose on a weekly basis from their school and/or work schedules. It would have been interesting/troubling/hilarious to find out that no, in fact the busiest time to drink out doors was Tuesday morning. That would have suggested a problem of some other kind, either with the data, the drinking (of a bunch of people), or both (?).
Data Source: 311, Social Services
With respect to public drinking there was more variety at the types of places people were taking advantage of than for the other two categories. Most of these I covered in the other piece but a couple caught me off guard, one by its inclusion and a second by its exclusion. Granted it is probably a catchall designation but the location of park/playground caught me. I had actually forgotten/not considered that as an option. Yet it makes plenty of sense sitting back thinking to my younger days (hey, Mom!).
One thing to always keep in mind when mapping feature instances is that you don’t simply plot where the people are. Of course larger populations have larger instances of… take your pick. The point is to see if there are any disparities in relevant populations and comparable sizes. The Lorenz curve and Gini index resolve that issue and to put your mind further at ease I have included a top five of the most active Community Districts (CD), as calls per 100,000 people.
| borocd | total_pop | cnt_311 | per100k | neighborhoods |
|---|---|---|---|---|
| 204 | 146441 | 43 | 29,4 | Concourse, Highbridge & Mount Eden |
| 202 | 52246 | 11 | 21,1 | Hunts Point, Longwood & Melrose |
| 414 | 114978 | 19 | 16,5 | Far Rockaway, Breezy Point & Broad Channel |
| 402 | 113200 | 17 | 15,0 | Sunnyside & Woodside |
| 103 | 163277 | 23 | 14,1 | Chinatown & Lower East Side |
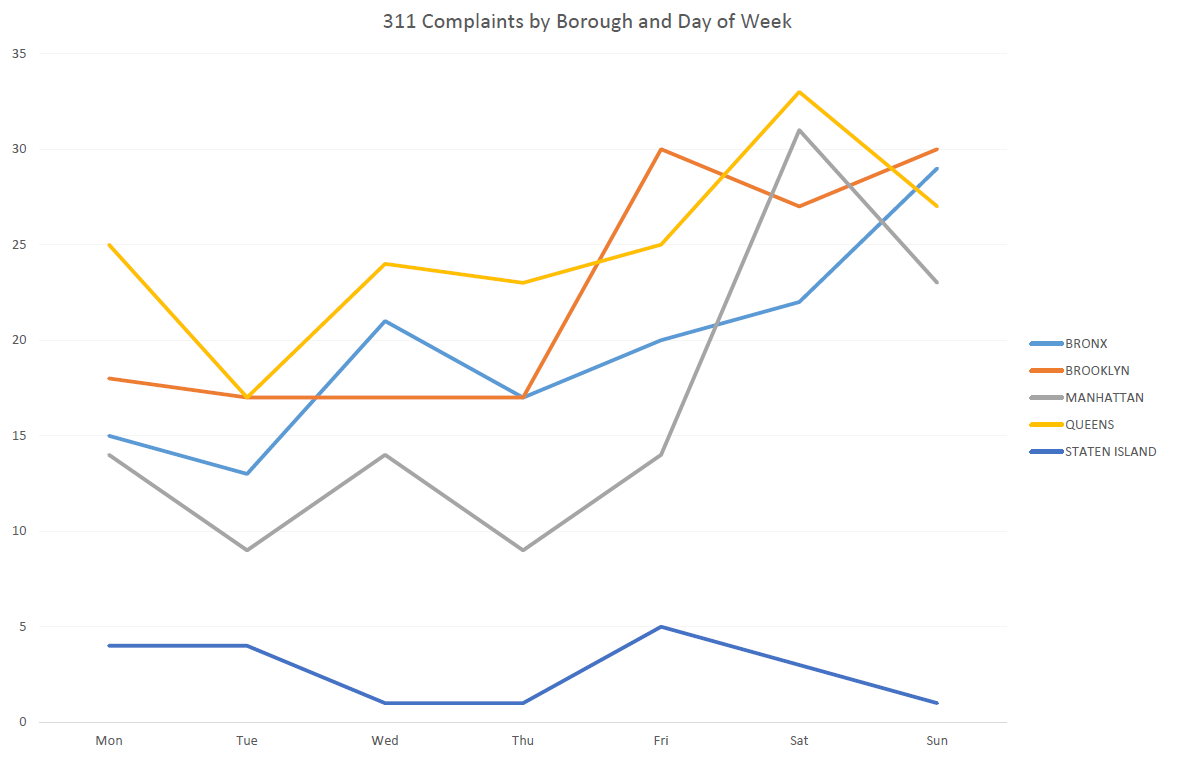
It appears that once again, but in a different venue, the Bronx and Queens are at it again, battling it out for supremacy. While it was at one time for the center of 80’s hip-hop, today we are talking about lush behavior. And tattle tailing. Not so very hip-hop.1
Data Source: 311, Social Services
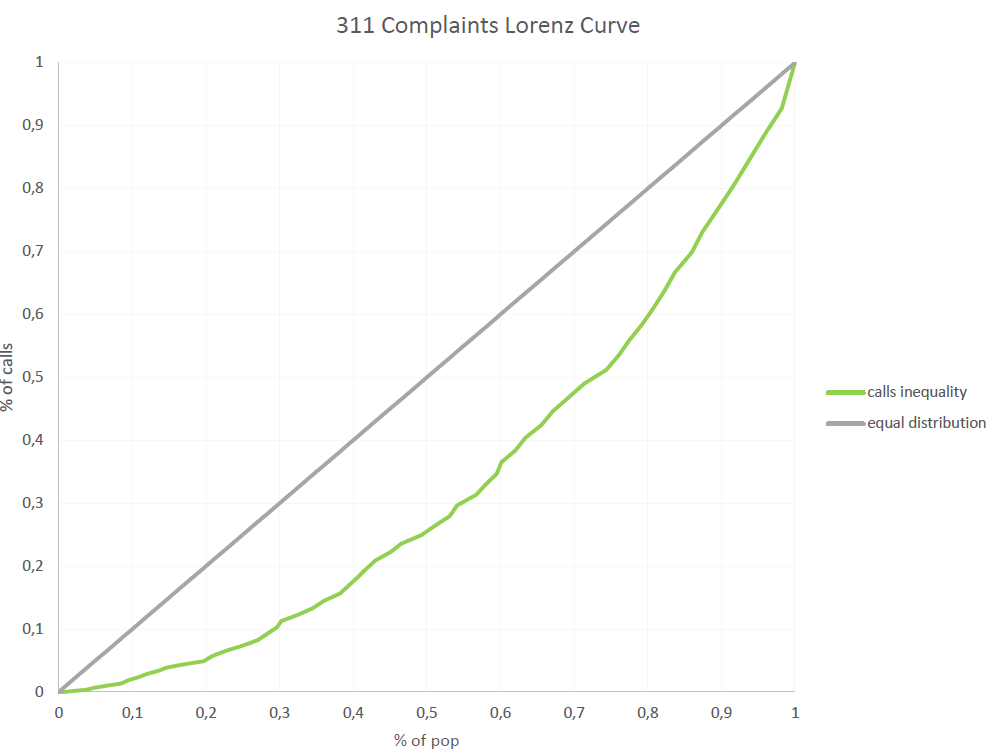
To get an idea of the distribution of 311 calls across Community Districts (CD) I plotted a Lorenz curve. All things being equal we would see a 45° line overlapping the gray one, or close to it. This being America, of course things are not equal (see: incomes; access to education, daycare, public transportation, healthcare; incarceration of minorities; etc. Let’s stop there before we really get bummed out.). Not too bad, Gini = 0.34, compared to income inequality to be sure, but there was a disproportionate influence of certain CD’s to the number of 311 calls for drinking disturbances in the summer of 2016. Whether these calls represent a true higher rate of drinking violations and/or concerns, a more proactive citizenry, or a combination of both is for the moment unclear and difficult to say.2
Lastly, I ran an sklearn feature selection using f_regression and identified the percentage of hispanic, white, and median income of a CD as the the three best features, in that order, of determining the number of complaints.3
Major takeaway? Go ahead and drink. Six hundred calls isn’t that much. Just remember to keep your head on a swivle in case you need to relocate.
Notes
1 Don’t snitch! ↩
2 I could download 311 data for all calls and get an idea of cal activity across all types of issues and see how the drinking stacks up, but it just became summer 2017, the weather is spectacular, and I am not going to spend an extra minute in front of the screen more than I have to. Incidentally, this could be a whole other post or something a reader can pick up and make even more interesting through whatever additional spin they managed to put on it. ↩
3
1 No real point. Just sharing. ↩
Sources
Gini https://www.youtube.com/watch?v=0Vv930-sDTI
Lorenz https://www.youtube.com/watch?v=tNoxEmfyNU0
shapefiles: http://www1.nyc.gov/site/planning/data-maps/open-data/districts-download-metadata.page
311: https://data.cityofnewyork.us/Social-Services/311-Service-Requests-from-2010-to-Present/erm2-nwe9
income/unemployment: 2011-2015 American Community Survey 5-Year Estimates
demographics: 2010 Census; Table SF1-DP CD: Demographic Profile - New York City Community Districts 2000 and 2010
Images