How many chances can you give a brewery before you give up on one of its beers? Certainly some level of leniency is advisable. The quality of the beer you drink is a factor of many influences, all along a supply chain that the brewery is not directly responsible for. The beer may have been poorly stored, kept too long, transported negligently, or had issues with sealing. Perhaps it was a bad batch. We move up the supply chain and closer to the source with each step. Gradually the level of responsibility upon the brewery grows. At the end of the day, the partnerships made by the brewery are also its responsibility and so the brewery may never quite escape all blame.
I moved to a new part of the world recently. Before doing so I sampled the beer in the area. It was not a deciding factor in the decision but I wanted to know what I was getting myself into. At the same time I was moving to a culturally beer rich area so there was never much concern about the prospects. Just the same, I wanted to know what I was getting myself into. For the most part I was excited by what I found and felt confident that while my choices would be different my access to quality, styles, and experimentation would remain high. Among the beers I tried was a local IPA. I found it a reasonable likeness to solid offerings back home. Since the move I have had ample opportunities to imbibe this and other beers.
Over time I have imbibed much more of the latter and ever more wearily from the former. Sadly, I have come to find this initially pleasant beer to be of inconsistent quality. This inconsistency has happened often enough (consistently enough, ironically) to not just come as a momentary surprise soon put aside but present and ever lurking. I find myself wondering over each bottle whether it will be a “good one” or a “bad one.“
I have not found reliable and confirming information on how often customers come into contact with bad batch/quality commercial beer. This is unfortunate but plays into the flexibility of Bayes’ theorem. The beauty of the theorem resides in its ability to take prior beliefs, current evidence, input the information into an elegantly simple and derivable/explainable formula that provides updated probabilities. This reflects in large measure the way we operate as a species in the world.1
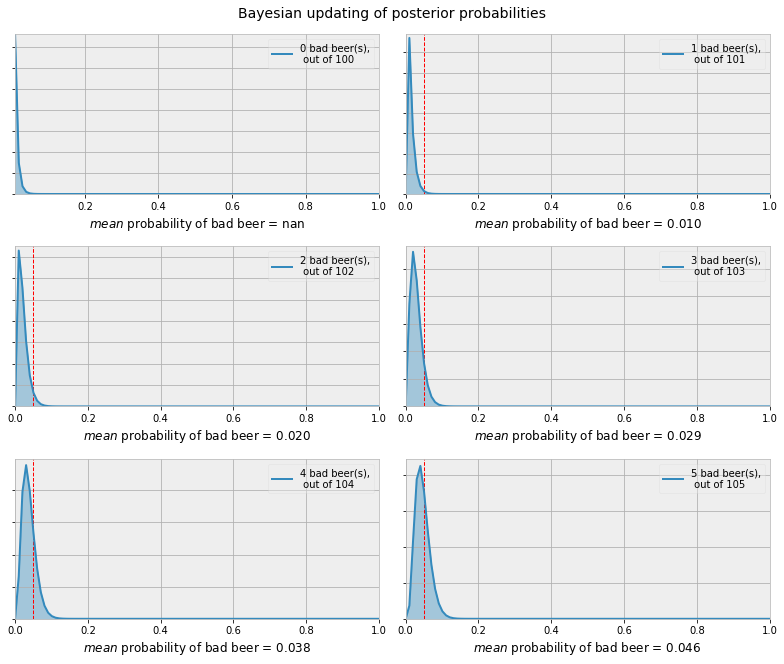
Here is a simple visual on updated expectations based on coming across a suspect beer. I started with the initial assumption that a bad beer, for any number of reasons, reaches a customer half of one percent of all batches brewed. To be specific, this is not an estimate on how often a bad batch is brewed, one hopes that the quality control apparati in place capture most of these issues and spill the beer before us poor unsuspecting schmucks crack one open, but how often a bad beer reaches the customer, whatever the cause. Again, this may result from various influences, many of them outside of the physical brewery and its influences.
Coding/Vis template: Probabilistic Programming and Bayesian Methods for Hackers
Reading the charts left to right and top to bottom, we see a very narrow and low probability of a bad beer. With the exposure of every additional inconsistent brew the updated probability grows (moves to the right) and widens (indicating greater quality variability). The red vertical dashed line is plotted at a 5% chance of coming across a poor beer. This is itself an arbitrary guide but I felt it necessary to draw the line somewhere. Should experience dictate that we can expect a poor beer at or around 5% of the time from a given brewery then I say it is acceptable, and about time, to give up on it.
A quick note on the updating of probabilities and assumptions relied on. We start out by front loading or giving the benefit of the doubt to any given brewery by setting the original proportions at 99.5 good beers to 0.5 bad beers. Again, these are beers from separate batches which is worth repeating since having a six pack provides only one data point, as does having beer from the same keg. Coming across an acceptable beer, by quality, while providing evidence does less so than coming across its opposite, given our assumption. Unless someone actually works in the quality department and has access to 100+ batches I see no reason to tally all of the acceptable beers. At the same time, to provide some lazy/naive regularization, each time a bad beer is counted we also increase the comparison set (denominator) by the same amount.
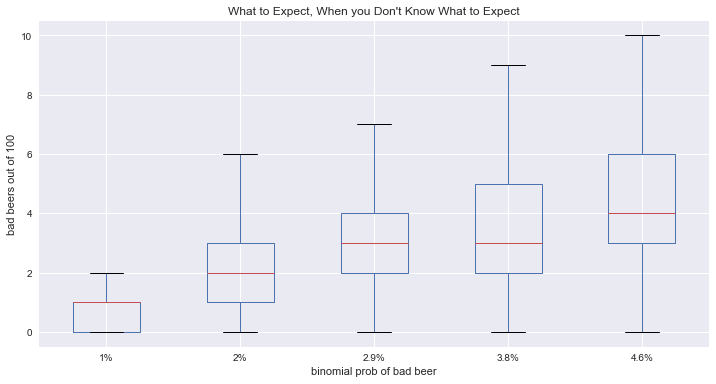
The idealized probabilities in the first chart give us an idea of the direction our expectations are generally leaning towards, and increasingly so in some unfortunate situations. Often times we are blissfully unaware of quality issues and have other beer considerations on our mind (e.g., food pairings, style preferences). If we do have a threshold (say, one of out 20 beers being poor) for deciding to cut off a beer we could use a little more information. Directly above is a boxplot representation of what happens when drawing between two states (good beer / bad beer) using the updated probabilities. This graph underscores an intuition many of us would probably share, that evidence of bad beer suggests more bad beer. Given the potential spread and current cut off we could be forgiven for stopping after a third bad brew, perhaps even a second.
Notes
1 Research is beginning to investigate the explanatory power of Bayes in all kinds of cognitive abilities, from as early on as six and eight month old babies. ↩