brw = read.csv('brewers_wholesalers.csv', skip = 1)
names(brw)

##  [1] "YEAR"                  "TRADITIONAL.BREWERIES"
##  [3] "SPECIALTY.BREWERIES"   "TOTAL.BREWERIES"
##  [5] "BEER.WHOLESALERS"      "X"
##  [7] "X.1"                   "X.2"
##  [9] "Year"                  "Count.of.Breweries"

head(brw)

##   YEAR TRADITIONAL.BREWERIES SPECIALTY.BREWERIES TOTAL.BREWERIES
## 1 1887                2,269                                2,269
## 2 1888                1,968                                1,968
## 3 1889                2,144                                2,144
## 4 1890                2,156                                2,156
## 5 1891                2,138                                2,138
## 6 1892                1,967                                1,967
##   BEER.WHOLESALERS  X X.1    X.2 Year Count.of.Breweries
## 1           3,309  NA  NA Census 1810                150
## 2           3,370  NA  NA          NA                 NA
## 3           3,603  NA  NA          NA                 NA
## 4           3,697  NA  NA          NA                 NA
## 5           5,039  NA  NA          NA                 NA
## 6           4,969  NA  NA          NA                 NA

tail(brw)

##                                                                                                                                    YEAR
## 115                                                                                                                                2012
## 116
## 117 Brewery Source: Historical Sources, TTB, and Brewing Industry Research Program, The Office of R.S. Weinberg, and the Beer Institute
## 118                Wholesaler Source: www.bls.gov - Quarterly Census of Employment and Wages and Historical Sources from Beer Institute
## 119
## 120                                                                                                                   Table of contents
##     TRADITIONAL.BREWERIES SPECIALTY.BREWERIES TOTAL.BREWERIES
## 115                    na                  na           2,751
## 116
## 117
## 118
## 119
## 120
##     BEER.WHOLESALERS  X X.1 X.2 Year Count.of.Breweries
## 115                  NA  NA       NA                 NA
## 116                  NA  NA       NA                 NA
## 117                  NA  NA       NA                 NA
## 118                  NA  NA       NA                 NA
## 119                  NA  NA       NA                 NA
## 120                  NA  NA       NA                 NA
brw = brw[1:115,1:5]
head(brw)

##   YEAR TRADITIONAL.BREWERIES SPECIALTY.BREWERIES TOTAL.BREWERIES
## 1 1887                2,269                                2,269
## 2 1888                1,968                                1,968
## 3 1889                2,144                                2,144
## 4 1890                2,156                                2,156
## 5 1891                2,138                                2,138
## 6 1892                1,967                                1,967
##   BEER.WHOLESALERS
## 1           3,309
## 2           3,370
## 3           3,603
## 4           3,697
## 5           5,039
## 6           4,969

colnames(brw) = c('year', 'traditional', 'specialty', 'total', 'wholesalers')
names(brw)

## [1] "year"        "traditional" "specialty"   "total"       "wholesalers"
brw = data.frame(sapply(brw, function(x) as.numeric(gsub(',', '', as.character(x)))))

## Warning in FUN(X[[i]], ...): NAs introduced by coercion

## Warning in FUN(X[[i]], ...): NAs introduced by coercion

sapply(brw, class)

##        year traditional   specialty       total wholesalers
##   "numeric"   "numeric"   "numeric"   "numeric"   "numeric"

brw[is.na(brw)] <- 0
summary(brw)

##       year       traditional       specialty          total
##  Min.   :1887   Min.   :   0.0   Min.   :   0.0   Min.   :   0.0
##  1st Qu.:1916   1st Qu.:  33.5   1st Qu.:   0.0   1st Qu.: 171.0
##  Median :1955   Median : 210.0   Median :   0.0   Median : 672.0
##  Mean   :1952   Mean   : 620.6   Mean   : 245.6   Mean   : 910.2
##  3rd Qu.:1984   3rd Qu.:1329.0   3rd Qu.:  11.5   3rd Qu.:1647.5
##  Max.   :2012   Max.   :2269.0   Max.   :2111.0   Max.   :2751.0
##   wholesalers
##  Min.   :    0
##  1st Qu.:    0
##  Median : 3609
##  Mean   : 4780
##  3rd Qu.: 8300
##  Max.   :17630
qcYear = range(brw$year)[1]:range(brw$year)[2]
gapYear = qcYear[!(qcYear%in%brw$year)]
prh = data.frame(matrix(c(gapYear, rep(0, length(gapYear)*4)), length(gapYear), 5))
colnames(prh) = names(brw)
prh

##    year traditional specialty total wholesalers
## 1  1921           0         0     0           0
## 2  1922           0         0     0           0
## 3  1923           0         0     0           0
## 4  1924           0         0     0           0
## 5  1925           0         0     0           0
## 6  1926           0         0     0           0
## 7  1927           0         0     0           0
## 8  1928           0         0     0           0
## 9  1929           0         0     0           0
## 10 1930           0         0     0           0
## 11 1931           0         0     0           0
brwComp = rbind(brw, prh)
dim(brwComp)

## [1] 126   5

tail(brwComp)

##     year traditional specialty total wholesalers
## 121 1926           0         0     0           0
## 122 1927           0         0     0           0
## 123 1928           0         0     0           0
## 124 1929           0         0     0           0
## 125 1930           0         0     0           0
## 126 1931           0         0     0           0
brwComp = brwComp[order(brwComp$year),]
tail(brwComp)

##     year traditional specialty total wholesalers
## 110 2007          20      1785  1805        2095
## 111 2008          20      1876  1896        2099
## 112 2009          20      1913  1933        2070
## 113 2010          20      2111  2131        2043
## 114 2011           0         0  2309        2039
## 115 2012           0         0  2751           0
library(reshape2)
library(ggplot2)
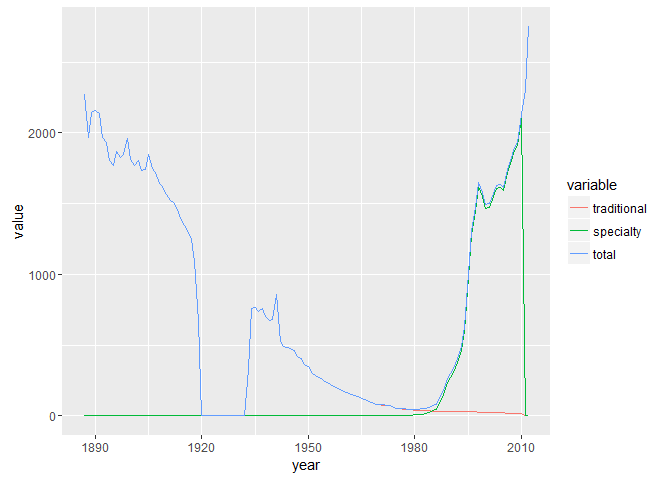
brwLong <- melt(brwComp[, 1:4], id = 'year')
b <-ggplot(brwLong, aes(year, value, color = variable))
b + geom_line()
library(zoo)
##
## Attaching package: 'zoo'
## The following objects are masked from 'package:base':
##
## as.Date, as.Date.numeric
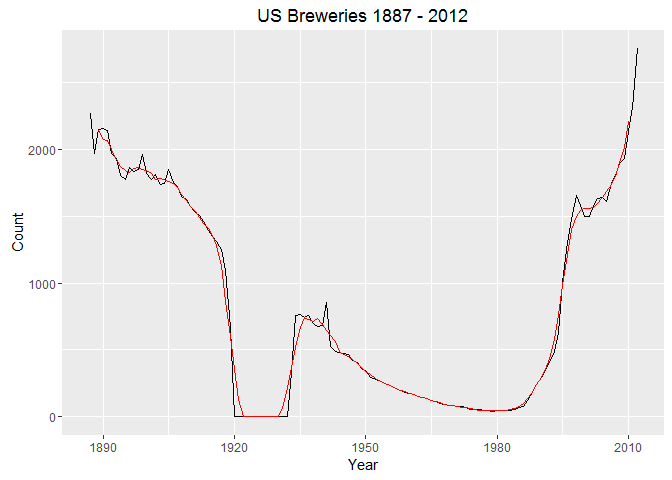
temp.zoo <- zoo(brwComp$total, brwComp$year)
m.av <- rollmean(temp.zoo, 5, fill = list(NA, NULL, NA))
brwComp$tot.av5 = m.av
ggplot(brwComp, aes(year, total)) + geom_line() +
geom_line(aes(year, tot.av5), color = 'red') +
labs(title = 'US Breweries 1887 - 2012', x = 'Year', y = 'Count')
## Warning: Removed 4 rows containing missing values (geom_path).
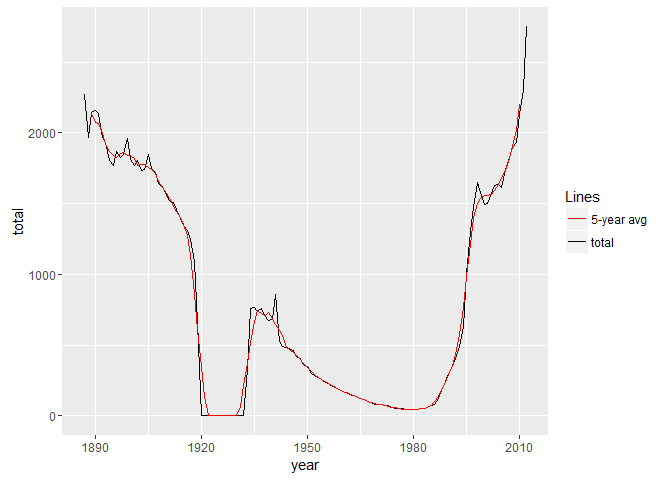
ggplot(brwComp, aes(year)) +
    geom_line(aes(y=total, color='total')) +
    geom_line(aes(y=tot.av5, color='5-year avg')) +
    scale_color_manual('Lines',
                       values = c('total'='black', '5-year avg'='red'))

## Warning: Removed 4 rows containing missing values (geom_path).
brwComp$perChgTot = 0
brwComp[2:126, 'perChgTot'] = brwComp[2:126, 'total']/brwComp[1:125, 'total'] - 1 ### replace NA's in prohibition years
brwComp$perChgTot[is.na(brwComp$perChgTot)] <- 0 ### what to use as % change for 1933 to not skew the data? ### what about ignoring it but highlighting it for special outlier status
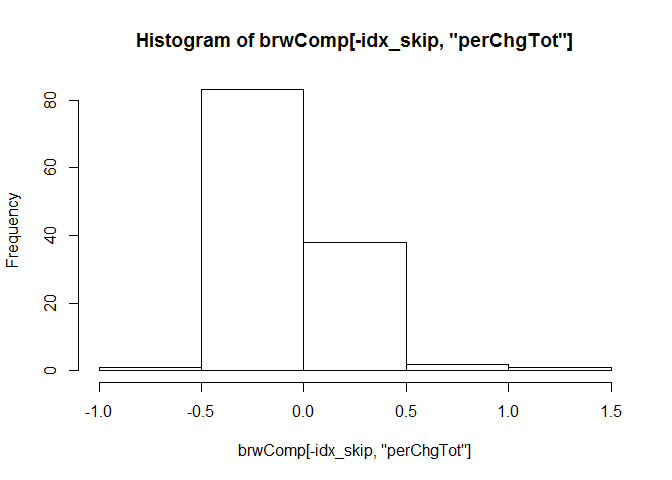
idx_skip = which(brwComp$year == 1933)
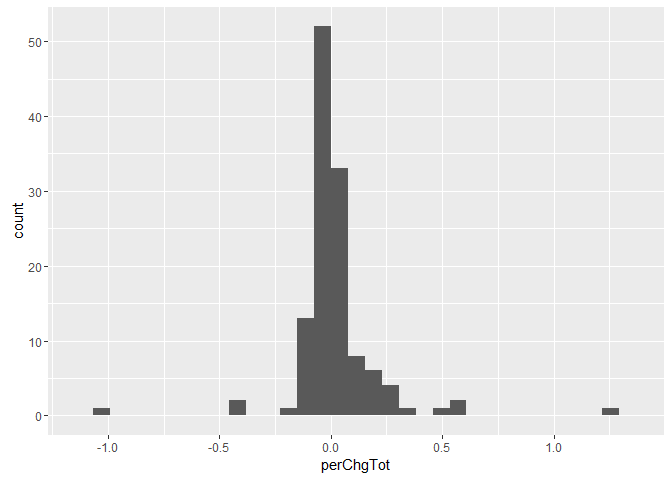
summary(brwComp[-idx_skip, 'perChgTot'])
## Min. 1st Qu. Median Mean 3rd Qu. Max.
## -1.00000 -0.05414 -0.01407 0.01086 0.02083 1.28400
hist(brwComp[-idx_skip, 'perChgTot'])
ggplot(brwComp[-idx_skip,], aes(perChgTot)) +
    geom_histogram()

## `stat_bin()` using `bins = 30`. Pick better value with `binwidth`.
perChgTot.sd = sd(brwComp[-idx_skip, 'perChgTot'])### kept 1887 (0%), should I have?
idx_1sdTot = abs(brwComp$perChgTot) > perChgTot.sd
idx_2sdTot = abs(brwComp$perChgTot) > perChgTot.sd * 2
idx_3sdTot = abs(brwComp$perChgTot) > perChgTot.sd * 3
brwSD=brwComp[idx_1sdTot, c('year', 'total')]
brwSD$sd = '1-sd % change'
brwSD$sd[brwSD$year %in% brwComp[idx_2sdTot, 'year']] = '2-sd % change'
brwSD$sd[brwSD$year %in% brwComp[idx_3sdTot, 'year']] = '3-sd % change'
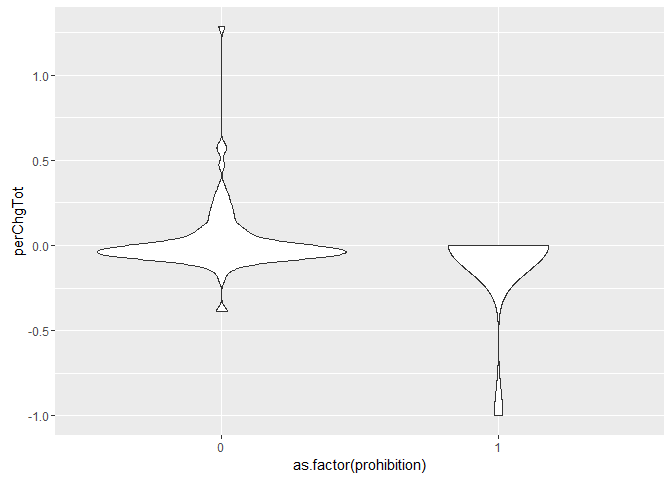
brwComp$prohibition = 0
prhYears = 1920:1933
brwComp$prohibition[brwComp$year %in% prhYears] = 1
ggplot(brwComp, aes(as.factor(prohibition), perChgTot)) +
    geom_violin(scale = 'area')

## Warning: Removed 1 rows containing non-finite values (stat_ydensity).
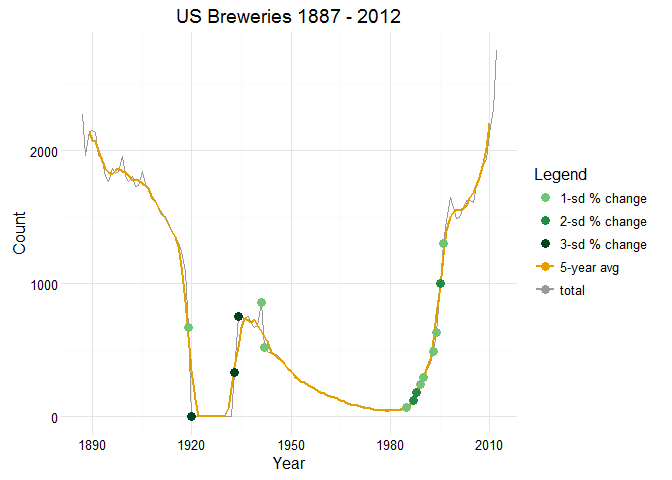
ggplot(brwComp, aes(year)) +
    geom_line(aes(y=total, color='total')) +
    geom_line(aes(y=tot.av5, color='5-year avg'), size=1) +
    geom_point(data = brwSD, aes(x=year, y=total, color=sd), size=3) +
    scale_color_manual('Legend',
                       values = c('total'='#999999', '5-year avg'='#E69F00',
                                  '1-sd % change'='#74c476',
                                  '2-sd % change'='#238b45',
                                  '3-sd % change'='#00441b'),
                       guide = guide_legend(override.aes = list(
                         linetype = c(rep("blank", 3), "solid", "solid")
                         ))) +
    labs(title = 'US Breweries 1887 - 2012', x = 'Year', y = 'Count') +
    theme_minimal()

## Warning: Removed 4 rows containing missing values (geom_path).
ggsave('us_breweries_historic.png', width = 16, height = 9)