The WBC is next week! If you’re like me those acronyms actually bring boxing to mind more so than beer. However, let’s not get stuck on putrid sanctioning bodies and “alleged” corruption in a brutal and beautiful sport. Instead, we’ll swig (Freud!), eh swing, our attention back to our regularly programmed topic. Similarly to boxing, however, we will be talking about competition: beer competition.
The WBC is the World Beer Cup or what I am starting to consider the “World” Beer Cup (wBC), the same way Americans like to have a championship for a sport only they play and declare themselves “World Champs”. Technically it is true, since no one else is competing and if others did participate there would still be no competition (as far as American football is concerned, anyway). So I’m thinking you should take their tagline of “The Most Prestigious Beer Competition in the World” with a grain of salt. Followed by a tequila (flavored beer) shot. Followed by a lime (flavored beer). But I digress, for the second time in as many paragraphs.
WBC v. wBC
Let’s take a look at some of the numbers to see what makes me so skeptical about calling this a full-fledged world competition. As exhibit A we will look at the entrant count by country for the previous Cup in 2014 with 4,750+ entrants.1
2014 WBC Participant Countries - Top-10 by Beer Entries
| country | entries | % of total |
|---|---|---|
| United States | 3402 | 0.715758 |
| Germany | 249 | 0.052388 |
| Canada | 190 | 0.039975 |
| Belgium | 89 | 0.018725 |
| Australia | 80 | 0.016831 |
| Japan | 71 | 0.014938 |
| United Kingdom | 69 | 0.014517 |
| Brazil | 63 | 0.013255 |
| Italy | 63 | 0.013255 |
| New Zealand | 50 | 0.010520 |
The top 10 countries sum to 91% of all entries, with the US accounting for 72% of all 2014 beer entries. The numbers are not quite “the 1% v. the 99%” but they do resemble the Pareto principle (the 80-20 rule). Let’s drive home the point with an arguably unnecessary chart:
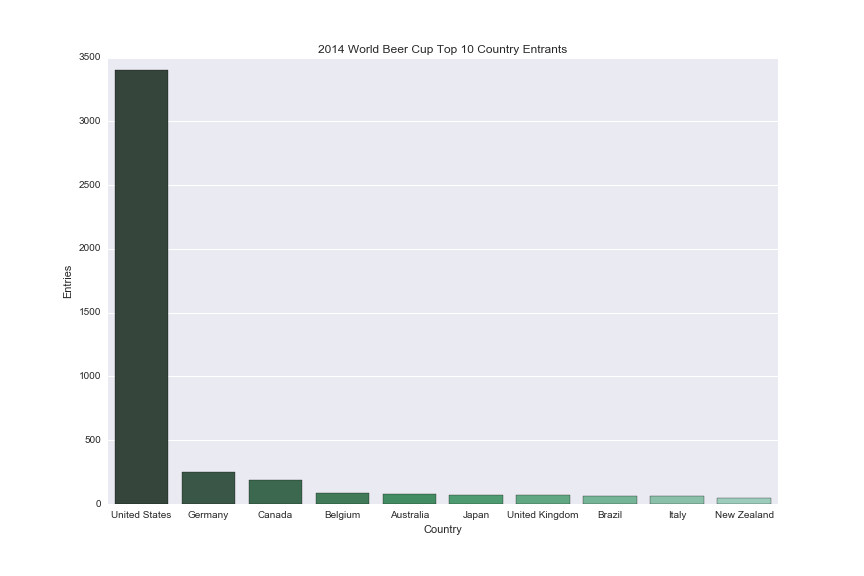
Data Source: World Beer Cup
Twenty-two of the fifty-eight participant countries in 2014 won at least one of the 281 medals awarded. When looking at the breakdown of the winning countries we get a similar picture to the one above. This time I will spare you the accompanying chart but will highlight this skew by listing the top ten winning nations (totaling 94% of the medal haul).
2014 WBC Winning Countries - Top-10 by Total Awards
| country | awards | % of total |
|---|---|---|
| United States | 205 | 0.729537 |
| Germany | 27 | 0.096085 |
| Canada | 7 | 0.024911 |
| Belgium | 5 | 0.017794 |
| United Kingdom | 5 | 0.017794 |
| Italy | 4 | 0.014235 |
| Netherlands | 3 | 0.010676 |
| Australia | 3 | 0.010676 |
| Czech Republic | 3 | 0.010676 |
| Japan | 3 | 0.010676 |
There is some difference between the two lists but predictably the top entrants tend to dominate the awards. No judgments, just pointing out the raw numbers and bringing everyone up to speed. Moreover, discrepancies of this sort are both not uncommon2 nor necessarily unfair. Consider that each nation is different with respect to its population, GDP, and brewing history, which all influence brewery counts. Perhaps it is no surprise then that, as mentioned in the next paragraph, the US has the most breweries: it is the richest country, has a long-standing European influence (relevant when discussing beer), and, of countries with any beer history, the largest population (China & India are not traditional hotbeds of beer as we modernly conceive of it and the next biggest country, Indonesia, is predominantly Muslim).
According to Alltech’s 2015 research the US and Europe account for 86% of the 10,000+ craft breweries worldwide (and let’s be clear, throwing in the number of macro’s is a rounding error so we can use these figures to represent the brewery count in total; note: we are not talking about bbl production). Additionally, the US with 4,000+ breweries has far and away the most breweries of any country. To sum up, I am not claiming the WBC to be unrepresentative of reality but it still makes me happy to refer to the Cup as either wBC or W(n)BC, World (not-quite) Beer Cup. After all, in 2014 California had more awards (36) than all other countries not named “USA” and two other states, Colorado (22) and Oregon (18), each had more awards than all but one other country, Germany (27).3, 4 Say it with me now: W-NNNN-B-C.
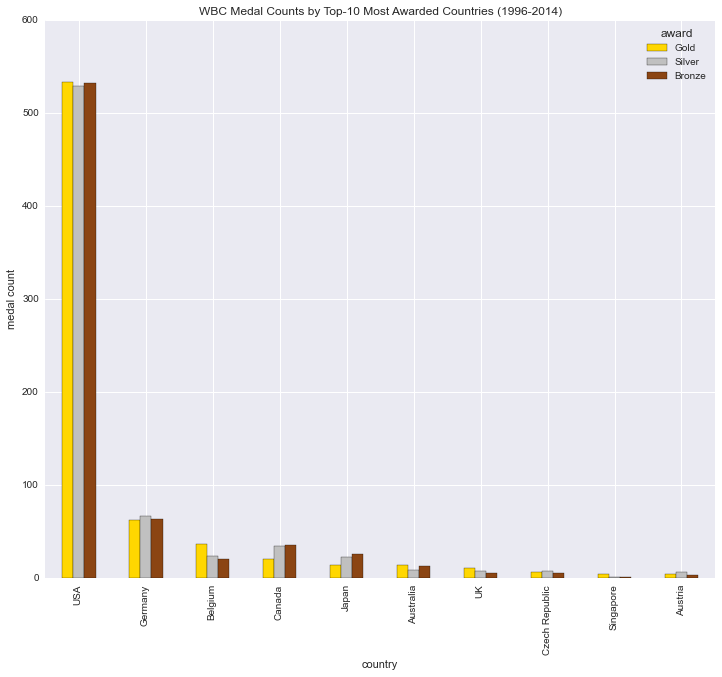
Data Source: World Beer Cup
Original Motivation
My initial interest in this year’s wBC (you see I’m not letting it go) was to look into past performances of countries and make predictions on the breakdown of awards for 2016. I will dispense with that portion now since once I saw the gross numbers and ran some fancy probability analysis the exercise became less interesting. The US has won between 65-to-75% of medals for any given year. Both the average and median are ~70%. Based on the similarity with recent past Cups, 96 styles being competed on and US the accounting for 71% of the participating breweries (accessed: APR-24, 2016), a medal haul in the range of 193 - 207, with an over/under for the wager-inclined at 201, seems reasonable.5
The Bayesian model run on the data6 is slightly more conservative in its distribution output (middle plot below) but I believe this is skewed by the low number of categories in the first few years. Even so, with this and the above mentioned similarity to recent years it would seem a safe bet that the US gets 190 medals, and likely closer to 200.
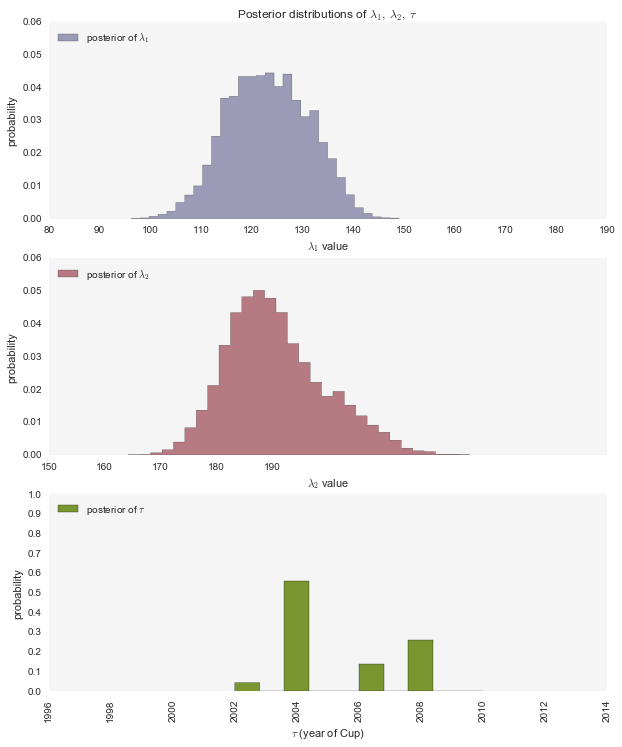
Data Source: World Beer Cup Data Model: Probabilistic Programming and Bayesian Methods for Hackers, Chapter 1
Similarly to attending a concert or sporting event with piss poor beer options (becoming less common), the above demotivated me from breaking down every country, at least in applying anything but a general past percentage rate extrapolation:
| Belgium | Germany | Japan | UK | USA | |
|---|---|---|---|---|---|
| over/under | 10 | 25 | 7 | 5 | 201 |
| range | 2 - 16 | 19 - 33 | (-1) - 13 | (-2) - 13 | 193 - 207 |
Naturally it will be interesting to see how the above compares to reality in a few days. Hopefully any major deviation will also provide an instructive hint at underlying changes.
Beyond Winning
The awards are certainly an honor and I expect the recognition bestowed upon past and future winners is well earned. Truthfully though I don’t really care that much about most of the breweries and categories represented by the WBC (I’m putting the capital letter back, no hard feelings) and yet that’s the beauty of the whole thing, as far as I’m concerned. We all win through the diversity and competition encouraged by having such an event.
That is why, no surprise considering the site claims “endless” as part of its name, we’re not quite yet done with this data set. In the coming week(s) I look to release some numbers and visuals regarding beer category evolution through the lens of the wBC (couldn’t help it) competition through the years, amongst other pieces. Please stay tuned.
Notes
1 Why not an exact number? In what will be a recurring theme, and something the WBC site warns about ahead of time, confirming exact numbers doesn’t always work out… well, exactly. In this instance, the “World Beer Cup 2014 Fact Sheet” claims 4,754 entrants for 2014 but when I sum the entrant numbers on a country-by-country basis off of the same document I get one less: 4,753 entrants. Whatever. ↩
2 See: European representation in FIFA World Cup (hmm, again with the “Cup”); UN Security Council; Ryder Cup (Cup? D’oh!); etc. ↩
3 These numbers reflect the ones proclaimed by the “World Beer Cup 2014 Fact Sheet”. The numbers that I came up with by looking at the WBC site and supplied PDF files were actually 28 for Germany and 17 for Oregon, but the point remains as stated. ↩
4 Not too dissimilar to US state GDP performance versus entire nations. ↩
5 288 medals up for competition (96 x 3); mind you, we are referencing listed breweries (1,452 US out of 2,057 total) as a proxy for beer entries; used +/- 2.5% around the median winning rate for range; US over/under naively set at midpoint between median and average winning rate. ↩
6 Hugely indebted to both IBM’s Data Science Workbench tutorial as a jumping off point and especially Probabilistic Programming and Bayesian Methods for Hackers, Chapter 1 in doing this work. ↩