Being such a the most prestigious beer competition™ one could be forgiven for expecting breweries to want to gain a World Beer Cup medal. As a light draws mosquitoes so would the wBC draw beers, to my thinking. With that idea in mind I was inspired by various questions1 to take a look at visualizing and summarizing the competitions through the years.
I had several expectations going in:
- Died-off categories would represent general brewery/industry neglect (Non-Alcoholic Malt Tonic), historical insignificance (American-Style Amber Light Lager), or both (American-Style Ice Lager). The latter turned out to be somewhat presumptuous; though we can split hairs on what it means to be a historically significant beer style it would be tough to argue against Belgian-Style Abbey Ale or European-Style Schwarzbier both of which were discontinued at one point or another from the wBC competition.
- A category that has disappeared may have either been re-classified as a sub-category and subsumed into an umbrella category or split into more specific categories. The first scenario has been mostly accounted for and taken into consideration when standardizing category naming conventions across years. For a breakdown of how categories were grouped please see here. Notable instances of the second scenario are “India Pale Ale” (96, 98, & 2000) becoming “American-Style India Pale Ale” (2002-14) & “English-Style India Pale Ale” (2002-14); and “Imperial Stout” (1996-2006) becoming “American-Style Imperial Stout” (2008-14) & “British-Style Imperial Stout” (2008-14).
- Newer categories, especially ones with high entry numbers, indicate craft beer trends (because the macros aren’t exactly leading the charge in creativity, beyond marketing) and possible bubbles. Interesting microeconomic implications here, especially for all the barrel-aged stuff.
- Some large categories may just be
a pissing contestan ego trip. Ahem, IPA’s.
Overview
 Data: World Beer Cup
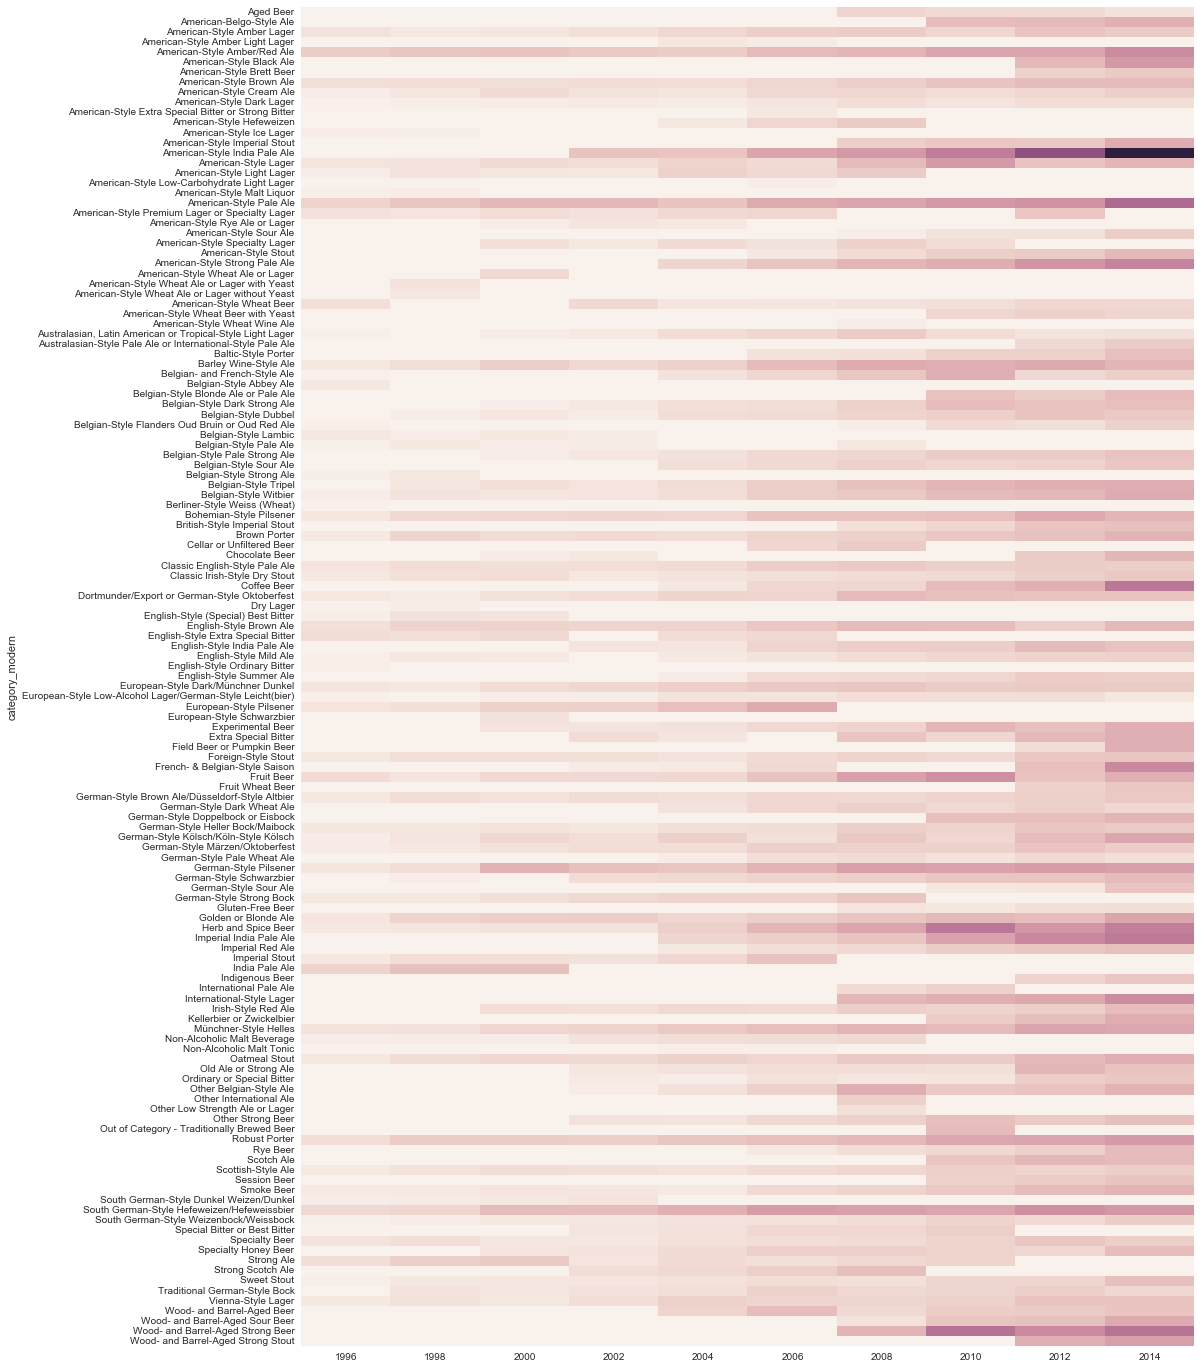
Above is a heatmap representing the number of contestant entries by WBC beer category for all past competitions (1996-2014). The beer categories are listed on the left in alphabetical order, the years appear across the bottom (left to right chronologically), and the darker the color the more entrants. Of course, the lighter the color the less entrants, with white indicating no entrants/competition for that beer style that specific year.
Quick takeaways:
- The chart is generally darker the further you scan to the right, meaning that more beers are entered each competition, at least for the categories that stick around.
- Scanning the right-most column brings up some white or blank boxes. These are categories that were most recently dropped, e.g. Strong Ale & Strong Scotch Ale (two of the easier ones to pick out since they’re right next to each other).
- The hot shot of the group is American-Style India Pale Ale with easily the most noticeably saturated block on the chart.
Sorted by Popularity
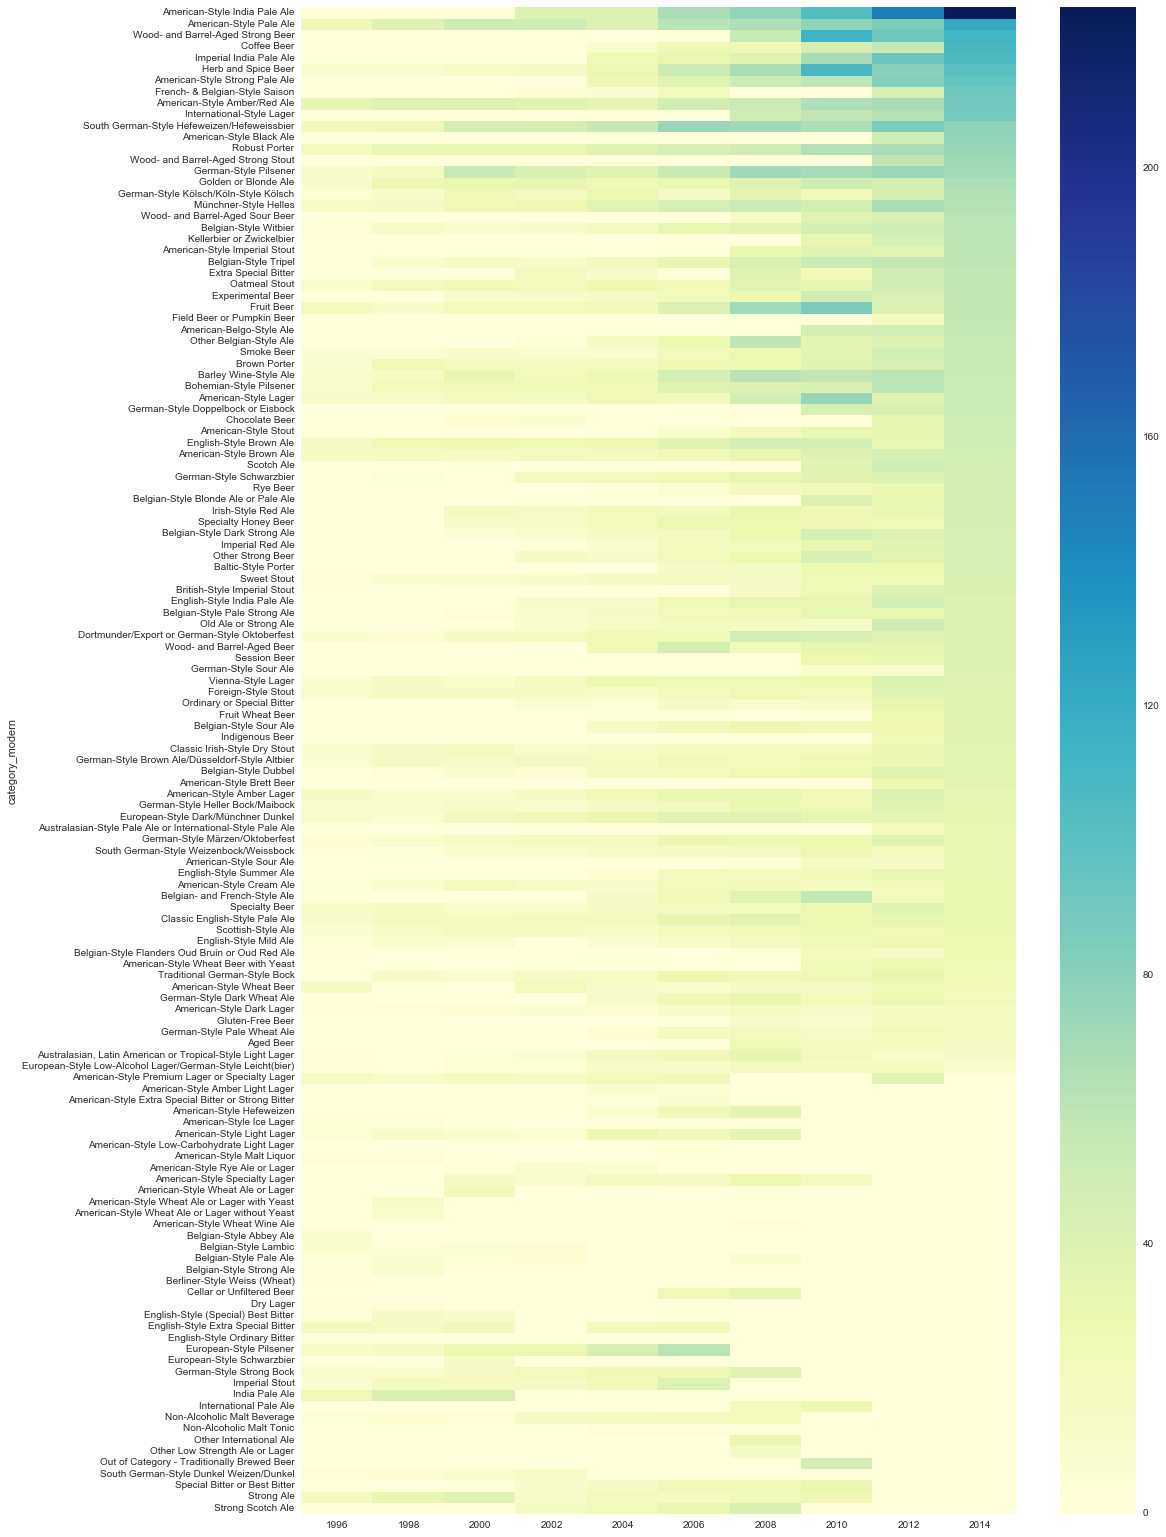
The above chart can be improved upon in a number of ways to allow it to deliver additional information more effectively. Two such improvements are implemented below. A scale has been added to the right to provide the user an idea of the size of numbers we are dealing with and not simply think of the entry counts in relative terms from one category and/or year to another. Additionally, the beers have been sorted in descending order of entrant counts for 2014 and 2012. This is a simple means of creating some level of order and allow quicker user lookup by category popularity, for lack of a better word (which I am routinely at a lack for).
Quick(er?) takeaways:
- We can still see that American-Style India Pale Ale is the king but as where before it wasn’t clear who was in second place (or 3rd or 4th) we can easily make that distinction now.
- Approximately the bottom third of the chart shows discontinued categories, we no longer have to scan up and down attempting to identify this group.
- To my thinking (again?!, aw yeah, again & again) this visual representation brings out trends and more easily raises questions we can ask of the data. One such question, which we address next, is which categories have been competed for at every WBC?
 Data: World Beer Cup
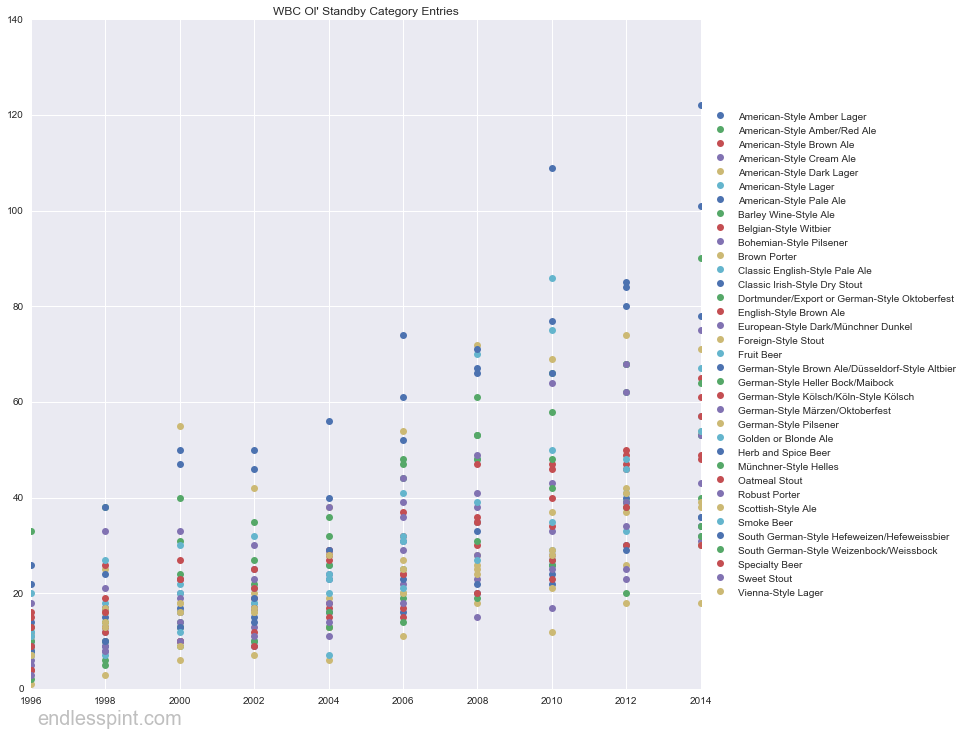
Ol’ Standby Categories
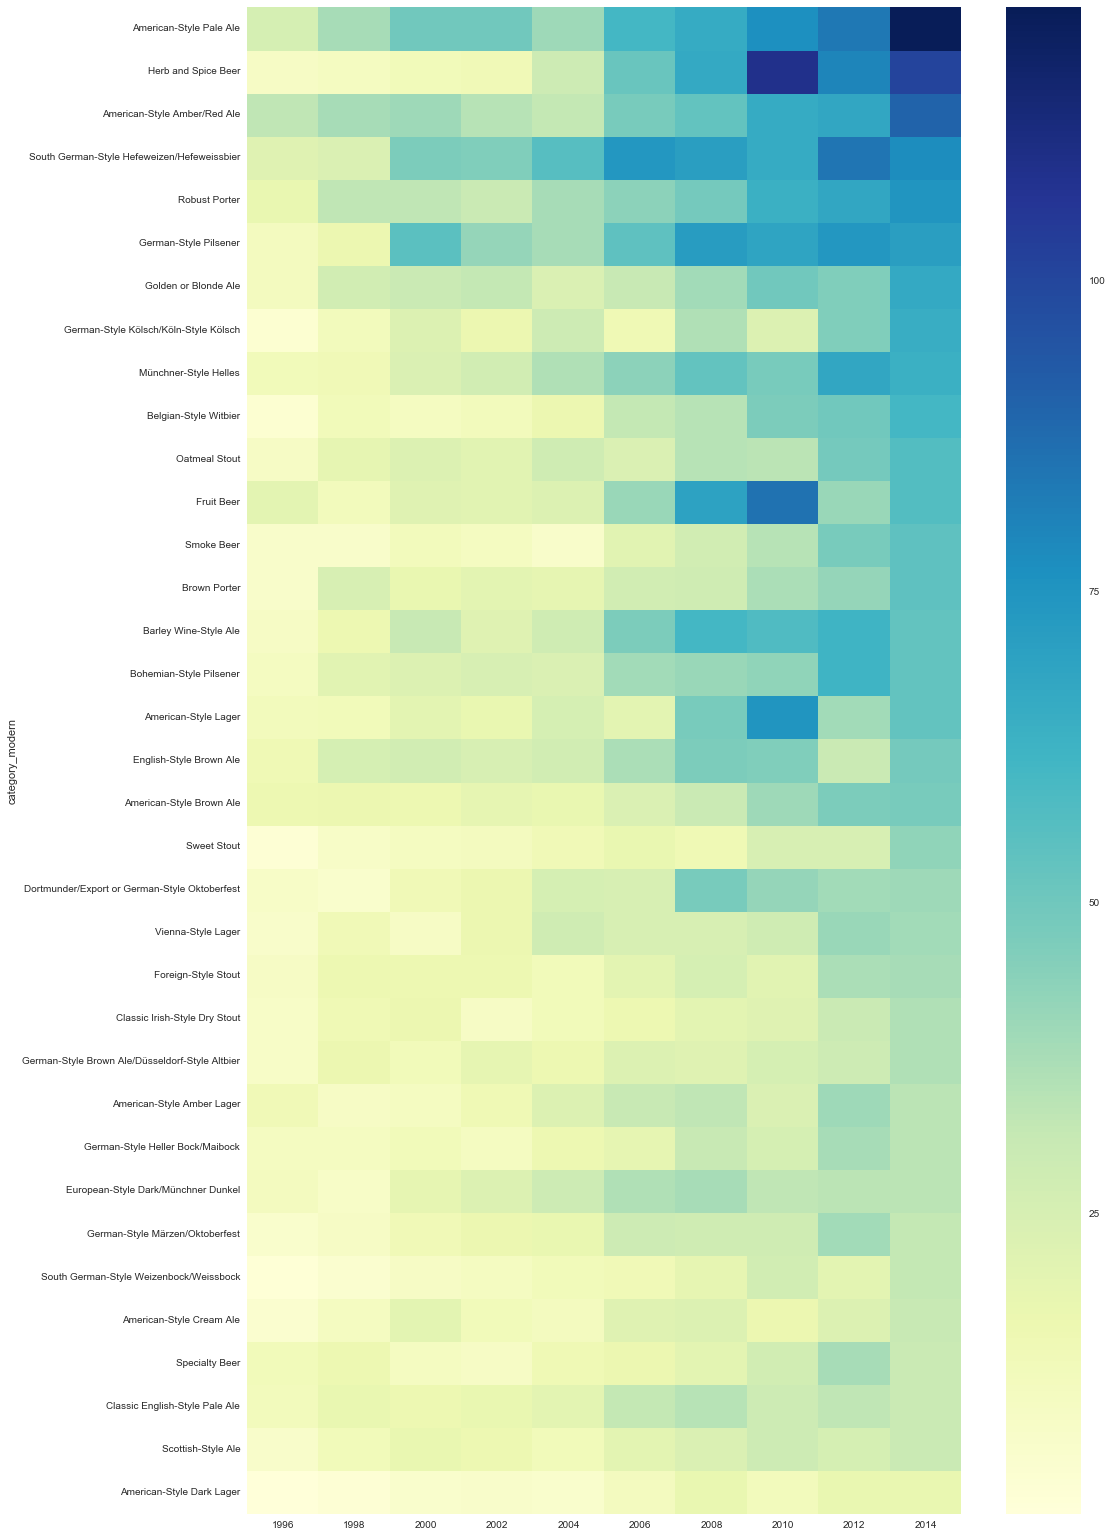
Admittedly the charts have been a lot to process due to the large number of beers/rows. Let’s look at a subset of the above. We’ll keep the improved features of the scaled color bar and sorted values and additionally filter out beers that have not appeared in every competition (again, 1996-2014).
 Data: World Beer Cup
It turns out there are 35 categories, I call these The Ol’ Standby’s, that have appeared in each of the past 10 World Beer Cup competitions.
Quick(ish) takeaways:
- Styles that received larger numbers in the early years retained and expanded on that advantage.
- There appears to be an even divide, with five competitions on either side, at or around 2004/2006 with a vertical line seemingly appearing between these years. It is a bit of a generalization but we can say that entrant numbers rose for this group as a whole quite distinctly at this time. This falls in line with a tau plot in a previous analysis.
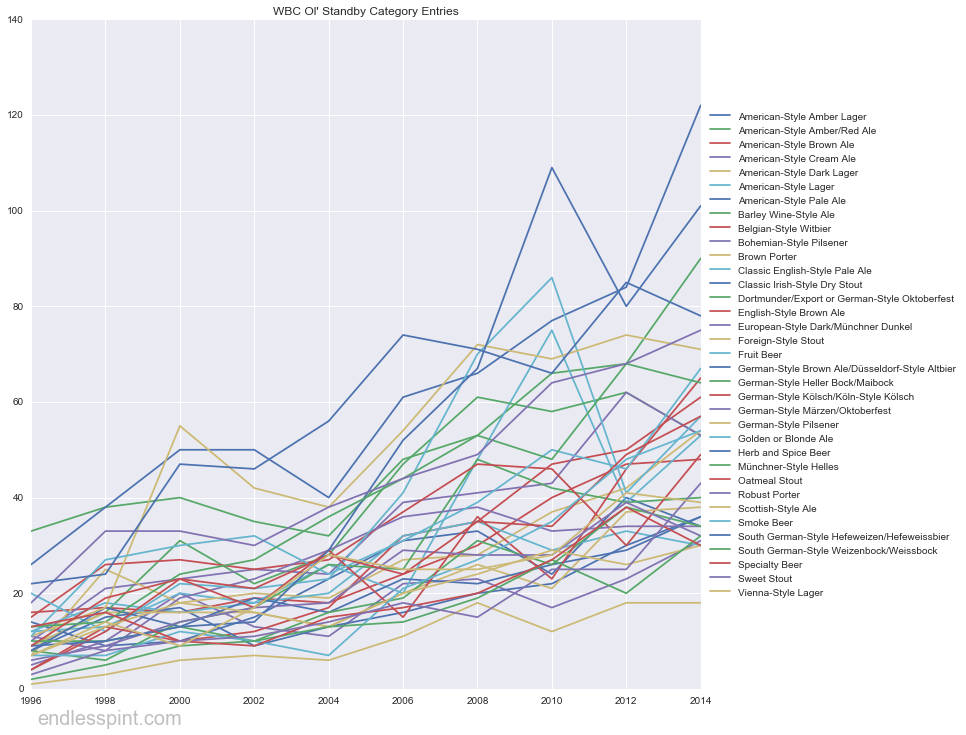
Spaghetti
Sticking with The Ol’ Standby’s, I decided to render two more plots for the hell of it. While they’re both a bit messy and too busy to be of a great amount of help on their own I do believe they help compliment what we’ve covered so far. How so? With the line graph below we have an even clearer idea of the numbers we are dealing with by way of the y-axis. Additionally, the lines themselves help the eye identify the trend quite clearly by way of their slopes/angles: more beers.
 Data: World Beer Cup
& Meatballs
The trend may be less obvious here but the “clumpiness” gives an idea on the spread of entrant counts.
 Data: World Beer Cup
Finally, some simple descriptive numbers on what’s been going on for the 35 Ol’ Standby’s as a group.
| 1996 | 1998 | 2000 | 2002 | 2004 | 2006 | 2008 | 2010 | 2012 | 2014 | |
|---|---|---|---|---|---|---|---|---|---|---|
| min | 1 | 3 | 6 | 7 | 6 | 11 | 15 | 12 | 18 | 18 |
| med | 9 | 14 | 18 | 18 | 23 | 27 | 35 | 35 | 41 | 49 |
| max | 33 | 38 | 55 | 50 | 56 | 74 | 72 | 109 | 85 | 122 |
Good Proxy?
How do the WBC entry numbers compare to the market?2 A dated (2011) but often cited report by SymphonyIRI Group lists the top craft beer styles by dollar sales. Here are the top 15: Seasonal, IPA, Pale Ale, Amber Ale, Amber Lager, Wheat, Bocks, Fruit Beer, Other Pale Lagers, Strong Ales, Light Beer, Porter, Belgian Ales, Stout, & Brown.
And below is how I’ve classified the WBC top 10 recent categories by the sales report findings:
WBC Top 10 Beer Categories by Entry Counts (2014) & Related Craft Beer Sales Style
| WBC Category | Craft Style (2011 Sales Rank) |
|---|---|
| American-Style India Pale Ale | IPA (2) |
| American-Style Pale Ale | Pale Ale (3) |
| Wood- and Barrel-Aged Strong Beer | Seasonal (1) / Strong Ales(10) |
| Coffee Beer | Porter? (12) |
| Imperial India Pale Ale | IPA (2) |
| Herb and Spice Beer | Fruit Beer (8) |
| American-Style Strong Pale Ale | Pale Ale(3) / Strong Ales(10) |
| French- & Belgian-Style Saison | Belgian Ales (13) |
| American-Style Amber/Red Ale | Amber Ale (4) |
| International-Style Lager | Other Pale Lagers (9) |
We certainly see some common ground between WBC category entry counts and market realities. This would seem to suggest that in the absence of market research or in avoidance of consulting fees you could use the competition as a starting point at getting an idea of the craft beer landscape. Perhaps using the competition as a factor in determining where new or existing breweries should focus their efforts for diversification and/or differentiation.
Notes
1 Things that make you go hmmmm:
- What would the rising & falling entry counts in various beer categories say about the industry’s production?
- More dramatically, what can we infer from died-off categories?
- … how about new categories, with especially strong numbers? ↩