Intro
The Great American Beer Festival (GABF) is the premier beer festival and awards competition in the United States, possibly the world. Breweries and brewers display their wins proudly and for good reason, especially with the explosion in the number of breweries, entrants, and the subsequent competition in recent years. The GABF is no fringe occasion as it may have been from 1983-86, when just three places were awarded in a sole category, compared to the 288 award winners across 90+ categories in 2016.1 Despite the steady growth of craft beer by volume, revenue, establishments and new adherents if search engagement is any indication the medals remain a niche interest. That is one of several hypotheses worth floating to help explain the low-to-non-to-occasionally-negative impact in Google Trends searches for last year’s award winners, the month following the festival.
Overview
Motivated by Google’s release of the CausalImpact R package the intention was to track the impact of winning a GABF medal on internet searches. The naive expectation was that medals would drive more interest to winning breweries and that Google searches would work as a proxy for this measure. The process was as follows:
- Identify all winning breweries (GABF).
- Gather Google Trends information three months prior and one month post festival.
- Merge and normalize trend numbers across multiple calls.
- Capture national brewery information from the Brewers Association.
- Categorize winners as Brewpub, Micro, Regional, etc. by joining GABF & BA data.
- Choose several medal winners from each brewery type with greatest relative uptick in search trends.
- Compare these winners against a random set of non 2016 GABF winners from the same state and brewery category.
Merge Trends
The Google Trends comparison interface is limited to five terms.2 What is one to do if you have, oh let’s just say, approximately 250 breweries? It is quite simple, the same thing if you had six terms. You repeat one term across each trend call and use this term as the normalizing key across the calls. For example, two calls with one term in common returns that term twice, in the first call with a score of 25 and in the second call with a score of 50. You now know that the terms and scores of the second call need to be multiplied by 0.5 (call one divided by call two: 25/50 = 0.5) in order to bring everything to the same scale. Now you have the first five terms and another two, one a repeat in the original five and the other an unique term on the same scale. The term in common serves as the key for joining the two calls and creating a comparison of six terms. If you have the aforementioned ~250 terms/breweries you repeat the process with each call, retaining the one repeat/join term with every new batch of four unique terms.3 You identify the scaling ratio for each new call against the original/seed call, multiply across the new call results, and proceed making an ever wider data frame/sheet.
Before, During and After
With the data frame in hand the time series was split into three parts: pre, during, and post GABF 2016 weekend (October 6 - 8, 2016). The purpose was to identify candidate breweries that experienced a significant change in Google search activity after their festival medal wins. An average of the trend search was taken for each brewery over each time frame. Breweries with the highest positive relative difference between pre and post GABF were considered for further investigation. Trends during the festival, while of passing interest, were set aside. The focus was on the impact of festival medals after the weekend and not the behavior of a concentrated set of super consumers.
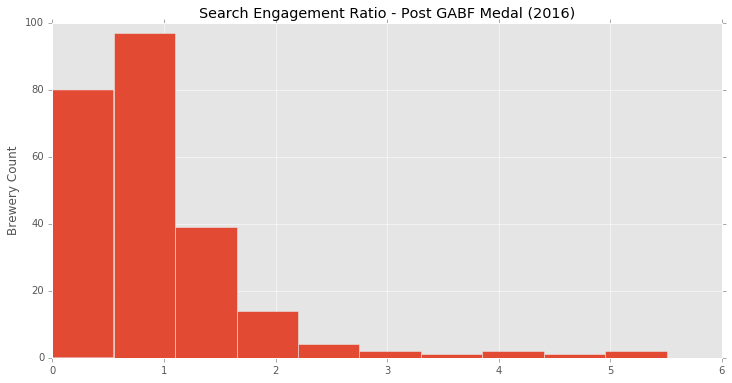
Global histogram. By taking a pre and post trend average for each brewery we are able to create a ratio for searches run on each brewery. The post GABF average is divided by the pre GABF search average, which is itself altered just a bit by adding a tiny regularization constant (+ 0.000001) so as to avoid zero’s in the denominator. The end result is a median of under 1.0, meaning that more than half of the GABF medal winners saw a decline in searches the month immediately following the festival versus the three months leading up to the competition.
Brewery Segmentation. Having identified the brewery type for each medal winner, and flagged the multiple award winners, we are able to get a more interesting look at the numbers. What we see is a slight improvement for recipients of multiple medals, certainly better performances as a group than their single-medal winning counterparts. The three main categories we will focus on are Brewpubs, Micro, and Regional breweries.
| Brewery Type | Count: One Medal | Search Change: One Medal | Count: Mult Medals | Search Change: Mult Medals |
|---|---|---|---|---|
| Micro | 127 | 0.94 | 13 | 1.08 |
| Brewpub | 59 | 0.73 | 10 | 0.98 |
| Regional | 24 | 0.77 | 4 | 1.13 |
| Large | 6 | 0.91 | 2 | 1.15 |
| Contract | 2 | 0.52 | - | - |
| Proprietor | 1 | 2.19 | - | - |
| n/a(+) | 1 | 0 | - | - |
(+) Craft Brew Alliance; multiple breweries combined, not clear how to measure.
Cherry Picking. The three brewery types in combination with the split between single and multiple medal winners provided six categories to choose candidates from for the R CausalImpact analysis. Each of these six segments was sorted by search ratio in descending order, with the top three performers returned for a closer look. After a quick glance it became appealing to pick one brewery form each of the following traditional craft beer bastions: California (Taps Fish House and Brewery), Colorado (12Degree Brewing), Oregon (Logsdon Farmhouse Ales) and Washington (Georgetown Brewing Company).
Three more breweries were selected to round out the comparison, these included the brewery with the highest medal count (Uberbrew, 4 medals), the brewery with the largest relative search gain (Hardywood Park Craft Brewery, 5.5 times greater searches post GABF) and, coincidentally making the cut for consideration, the brewery that had been used as the key in joining the initial Google Trend searches (Brown Truck Brewery, a 3-medal winning microbrewery from North Carolina).
Causal Shmausal
Each of the selected GABF medal winners above, cherry picked to ensure some variation of medal counts, brewery size (Brewpubs, Micro, and Regional) and region, were partnered with four random breweries that met the criteria of being from the same state, matching in brewery type as categorized by the Brewers Association and not placing in the 2016 GABF (no digging was done to identify if they had entered). With this new data set in hand it was back to Google to gather trend information that would help determine whether or not the awards could be considered candidates for the increase in search engagement.
| CI Candidate | State | Brewery Type | GABF ‘16 Medals | Trends Increase | Comparison Breweries |
|---|---|---|---|---|---|
| Taps Fish House and Brewery | CA | Brewpub | 1 | 2.08 | Downtown Joes Brewery and Restaurant; Taplands Brewery; Woods Bar & Brewery; Miner’s Alley Brewing Company |
| 12Degree Brewing | CO | Brewpub | 1 | 4.22 | Oskar Blues Brewery - Lyons; Whistle Pig Brewing Company; Brix Taphouse and Brewery; Moonlight Pizza |
| Logsdon Farmhouse Ales | OR | Micro | 1 | 3.99 | Mazama Brewing Co; Siuslaw Brewing; Krauskis Brewskis / The Hoppy Brewer; Red Ox Brewing |
| Georgetown Brewing Company | WA | Regional | 2 | 1.79 | Fremont Brewing Co; Redhook Brewery; Mac and Jacks Brewery Inc; Iron Horse Brewery |
| Uberbrew | MT | Brewpub | 4 | 1.11 | Bridger Brewing Company; Cabinet Mountain Brewing Co; The Front Brewing Company; Backslope Brewing |
| Hardywood Park Craft Brewery | VA | Micro | 1 | 5.5 | Lickinghole Creek Craft Brewery; Barrel Oak Farm Taphouse; Sunken City Brewing Co; New District Brewing Company |
| Brown Truck Brewery | NC | Micro | 3 | 2.89 | Good Hops Brewing LLC; Preyer Brewing Company; Fortnight Brewing Company; Burial Beer Co Forestry Camp |
In five of the seven comparisons no statistically significant effect could be attributed to the intervention (GABF weekend). The positive effect could just as well “be the result of random fluctuations that are unrelated to the intervention.” It is also possible that the intervention period was too short and/or the comparison breweries did “not correlate well with the response variable [GABF winner] during the learning period.”4
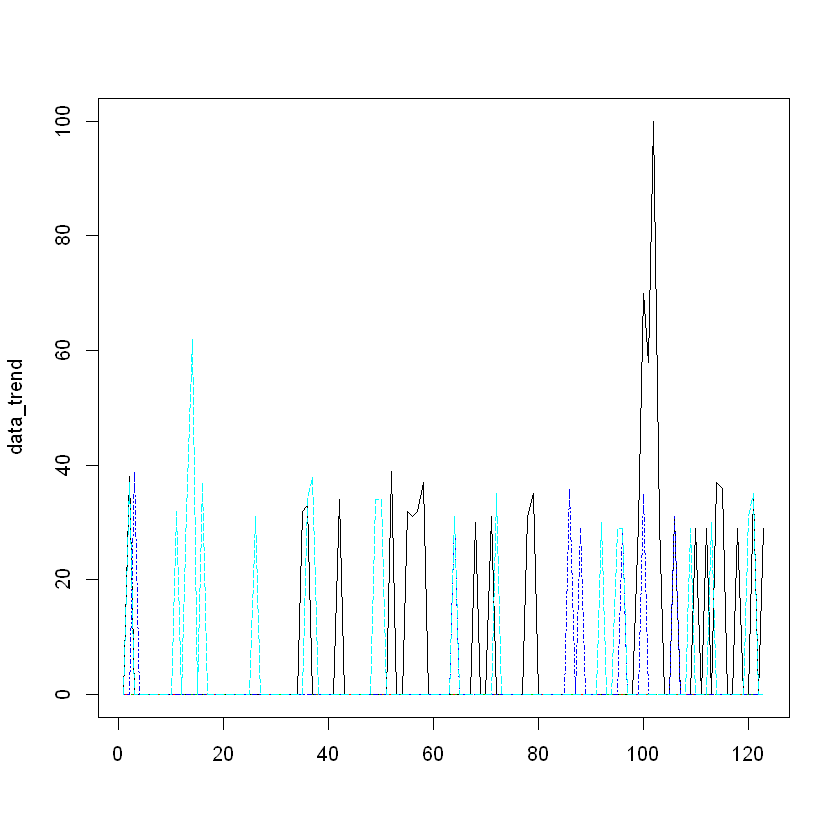
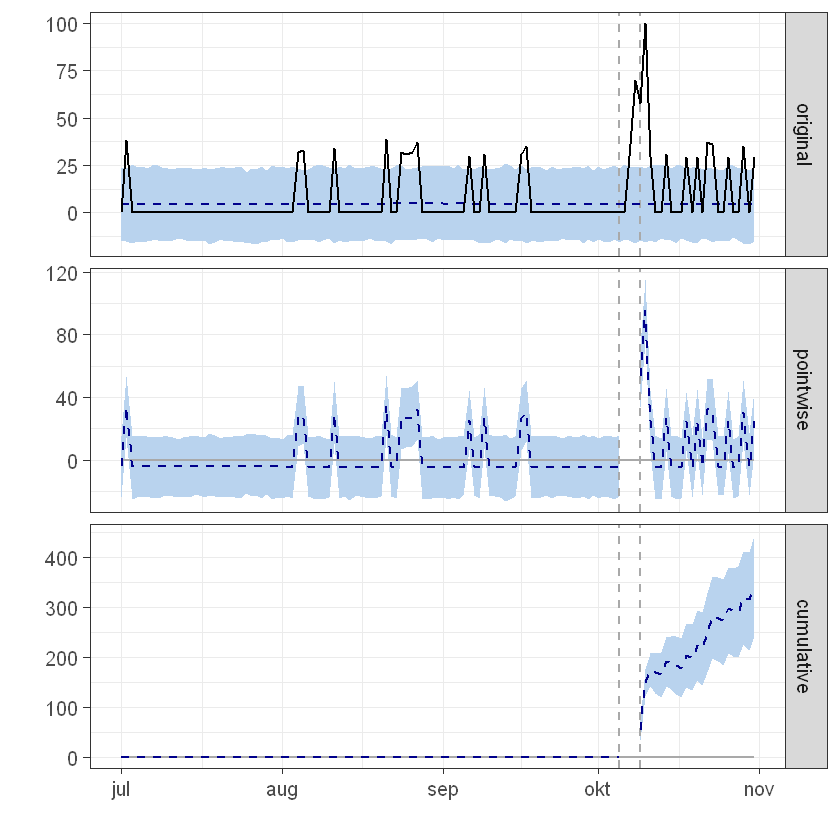
The two instances where “the positive effect observed during the intervention period [was] statistically significant and unlikely to be due to random fluctuations” were for Georgetown Brewing Company and Brown Truck Brewery (them again!, what are the chances?).5 Below are example graphs for the Brown Truck data set analysis.
The first plot shows overall performance for Brown Truck (in black) against the comparison Micro’s of North Carolina.
The second plot shows more clearly the peaks for Brown Truck, demarcated by the GABF weekend in vertical dashed lines and the predicted ranges in blue shading.
Picking Nits
Niche or not, another possibility is that the craft beer consumer is already fully engaged, certainly anyone willing to make the necessary arrangements and travel to Colorado for the event need say no more about their level of commitment. It could be that the interest in breweries peaks ahead of the festival weekend as the entrants are announced. This could happen for a number of reasons, including being able to best plan afternoons of limited time, gut space, patience with long lines, both at beer stalls and bathroom stalls, and alcohol tolerance against what is effectively endless beer at the event.
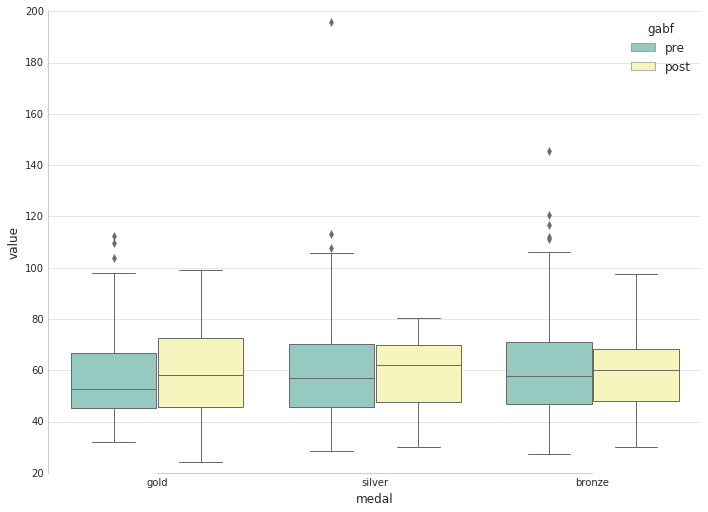
Despite a few outlier peaks the interquartile range of the two aggregated time ranges, pre [161 / 192 / 232] and post [160 / 201 / 231] GABF, give us reason to be skeptical of this. Additionally, we do not see any discernably consistent spike/trend in the months ahead of the event when splitting the winners by medal type. This could be accounted for by the incremental release of information as breweries confirm their participation and uneven awareness among consumers. This uneven awareness may cut both ways and have a dampening effect on searches after the GABF weekend, helping explain less than impressive numbers the following month.
Pre and Post GABF Searches by Medal
Using Google Trends may also be an inappropriate data source or at least less relevant than one of the three main beer resources currently in fashion: BeerAdvocate (BA), RateBeer (RB), and Untappd (UT). Moreover, there are the social media outlets to consider: Instagram, Twitter, Snapchat, and whatever else the children are using at the time of reading this and those aforementioned dinosaurs have been replaced. While Google is an ubiquitous search option for most people on most topics most of the time it is not always the answer.
Google Trends was selected for several reasons: ubiquity, data access and data summarization. With respect to social media not everyone has an account and not everyone has an active account on each platform. The splintering of posts across multiple social sites both downplays the overall interest and overstates the peak engagement when starting from a lower base rate on a particular/respective site.
BA & RB allow for user ratings and feedback, that being one of its many appeals but they are also used as references to quickly look up beers/breweries to find said ratings. It is unclear how often people rate in comparison to the lookup rate but if the low to non-existing number of total ratings on certain beers is any indication it may be substantial. However, this information is not readily available.
UT at least makes it appealing to quickly take credit for having a brew, that and knowing what is available in surrounding areas are its original attraction, a sort of scrap book, headhunting exercise. Intuitively I found the idea of UT “check ins” to be uninteresting. The fact that you have a high concentration of high spending consumers with social engagement resulting in a bump in numbers would be unremarkable. The possibility of there being a bump in Google Trends could be argued to be equally unremarkable but since the bump is missing in most cases the more remarkable insight is that the hound did not bark in the night.
With no consistent search increase how about looking at the business end to determine attention? That is a bit tricky. First, there is the matter of gaining access to small business financial information. Beyond that, for anyone who may look into this angle they will have to keep in mind that beer is a small margin business; in order to pay off debts and/or remain profitable these businesses routinely need to continue growing (e.g., economy of scale). Thus one has to be wary of survivorship bias: the award winners that are still in business may by definition have had to continue growing, it may have nothing to do with the award itself.
Conclusion
GABF medals do not appear to move the needle on Google searches. This comes as both a bit of a surprise and a disappointment. It may be the the time span considered was too short and that may warrant additional analysis. However, one sixth of the medal winners had no Google Trends info at all. This would suggest that certain breweriers could be doing more to be make their presence better known and that the GABF could offer more publicity.
Good beer will sell itself, but in a crowded market there is no guarantee that you will be the one to address that thirst. It would behoove both the individual players and the industry cheerleaders to put the little guys on stable ground.
Notes
1 As with sports we can look back and divide the GABF past into the formative years and the modern era. The GABF 1987-present fits into the latter label by dint of multiple categories, award winners, and a constantly growing and more professional field. ↩
2 There is currently no API and getting another R package, gtrendsR, to work was more trouble than it was worth. ↩
3 For the url link search, substitute out extra spaces, ampersand and special characters, place commas in between terms, and set the desired date range with category (71, food and drink) of choice. All of the aforementioned may be determined by using the Google Trend interface, creating a desired test search and viewing the resulting address request. ↩
4 Here is a typical example of the canned phrasing from the package output:
This means that, although the intervention appears to have caused a positive effect, this effect is not statistically significant when considering the entire post-intervention period as a whole. Individual days or shorter stretches within the intervention period may of course still have had a significant effect, as indicated whenever the lower limit of the impact time series (lower plot) was above zero. The apparent effect could be the result of random fluctuations that are unrelated to the intervention. This is often the case when the intervention period is very long and includes much of the time when the effect has already worn off. It can also be the case when the intervention period is too short to distinguish the signal from the noise. Finally, failing to find a significant effect can happen when there are not enough control variables or when these variables do not correlate well with the response variable during the learning period.
The probability of obtaining this effect by chance is p [> 0.05]. This means the effect may be spurious and would generally not be considered statistically significant. ↩
5 Part of the output for Brown Truck Brewery:
This means that the positive effect observed during the intervention period is statistically significant and unlikely to be due to random fluctuations. It should be noted, however, that the question of whether this increase also bears substantive significance can only be answered by comparing the absolute effect (14.77) to the original goal of the underlying intervention.
The probability of obtaining this effect by chance is very small (Bayesian one-sided tail-area probability p = 0.001). This means the causal effect can be considered statistically significant. ↩